Introduction
When developers run a website test in tools like PageSpeed Insights, Google Search Console, or Lighthouse, they often see two different kinds of performance data: lab data and field data (CrUX).
Many developers improve their Lighthouse scores but still see Core Web Vitals issues in Search Console. A common reason is misunderstanding how the Chrome UX Report (CrUX) actually works - what gets measured, who contributes data, and how Google turns millions of samples into the numbers you see in dashboards.
This article walks through the lifecycle of CrUX data collection, from a real user visiting your site in Chrome to aggregated reports in Google surfaces.
Related guides: Debugging hidden LCP when PageSpeed Insights passes, Lighthouse vs Core Web Vitals, viewport width and 412px in lab testing, and the 28-day CrUX rolling window.
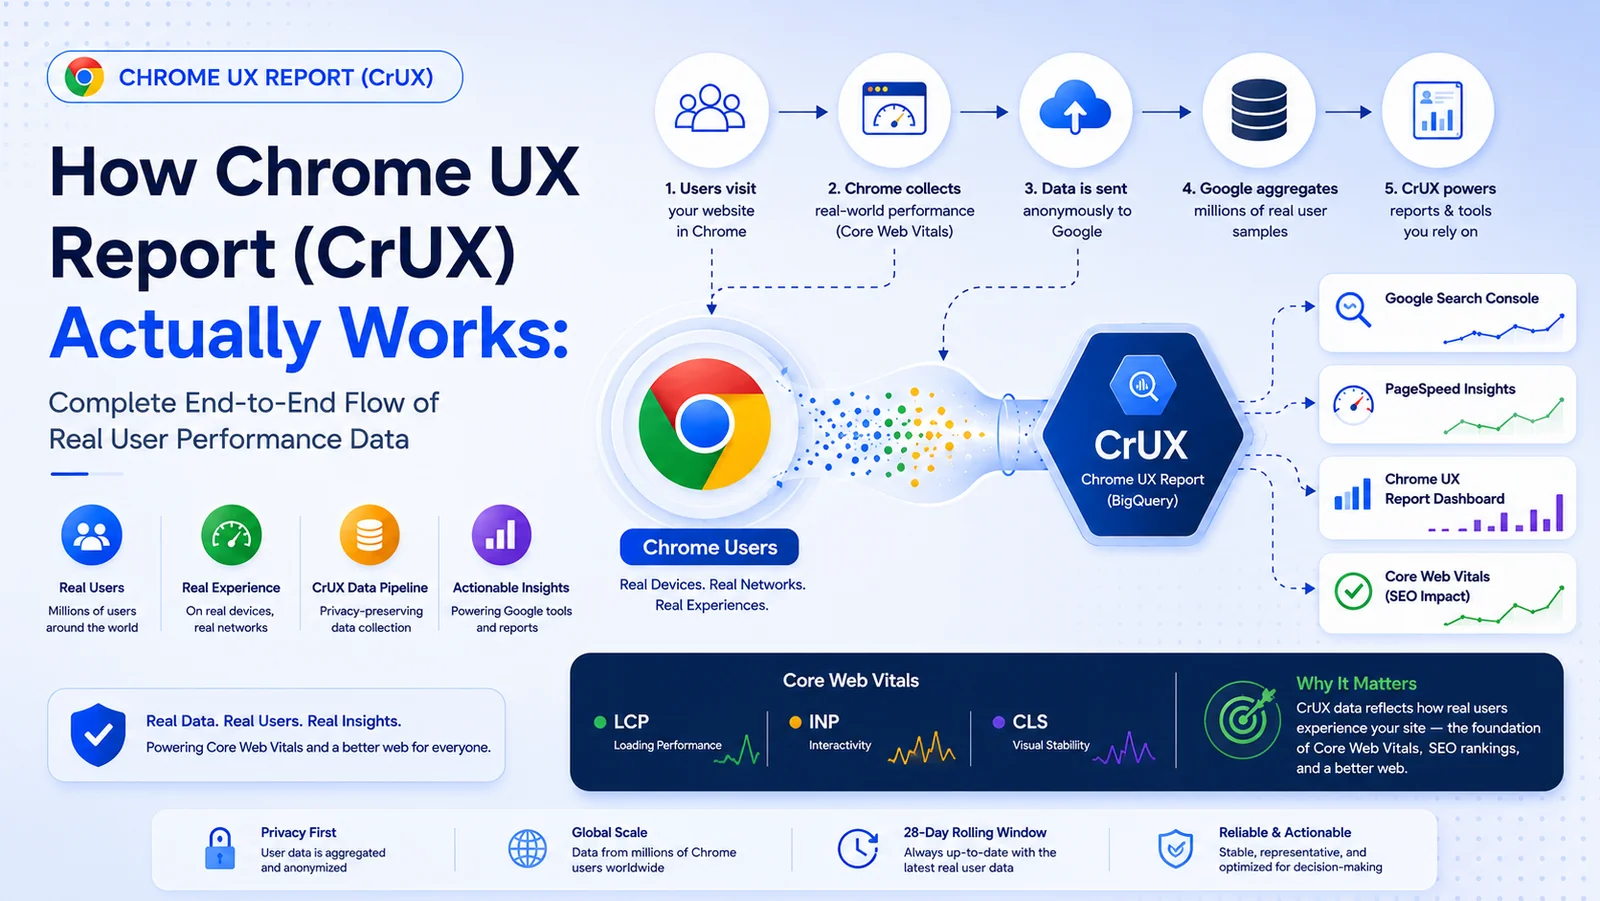
What Is the Chrome UX Report (CrUX)?
The Chrome UX Report (CrUX) is a public dataset built from real-world performance measurements collected from Chrome users who opt into sharing usage statistics (where that applies).
Unlike Lighthouse, which runs a controlled synthetic test, CrUX reflects:
- Real devices
- Real networks
- Real user interactions
- Real browser rendering conditions
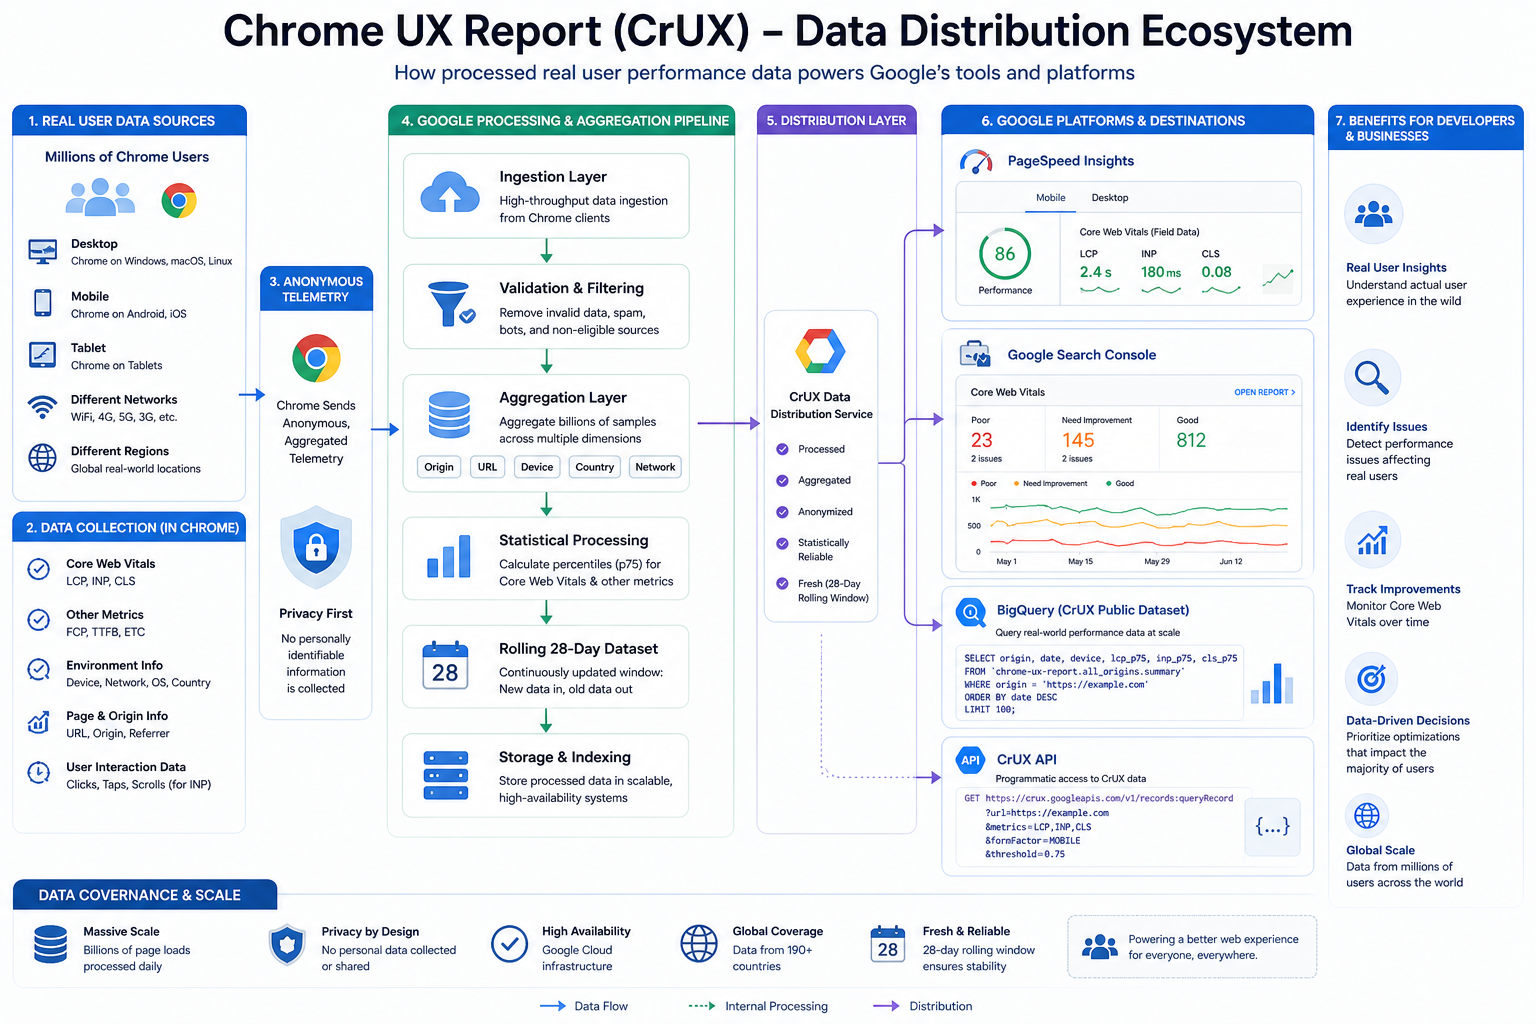
CrUX powers field data in tools and datasets such as:
- PageSpeed Insights (Origin and URL segments when available)
- Google Search Console Core Web Vitals reports
- Ranking-related signals tied to Core Web Vitals (field experience)
- BigQuery CrUX tables
- The CrUX API and public monthly release on Chrome for Developers
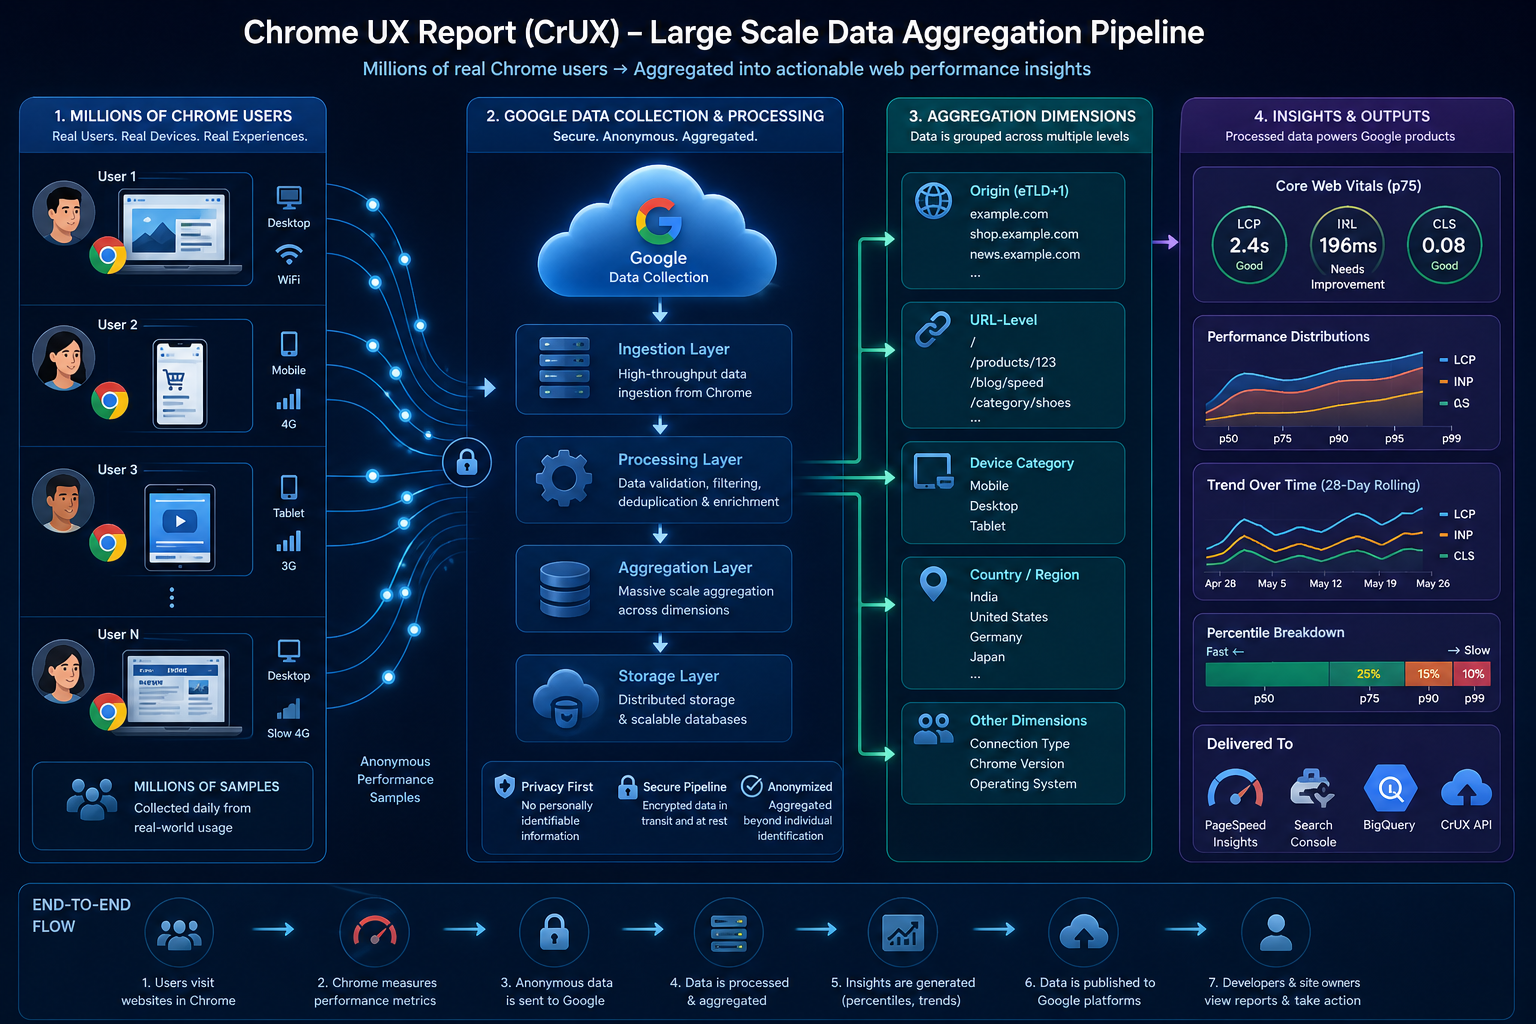
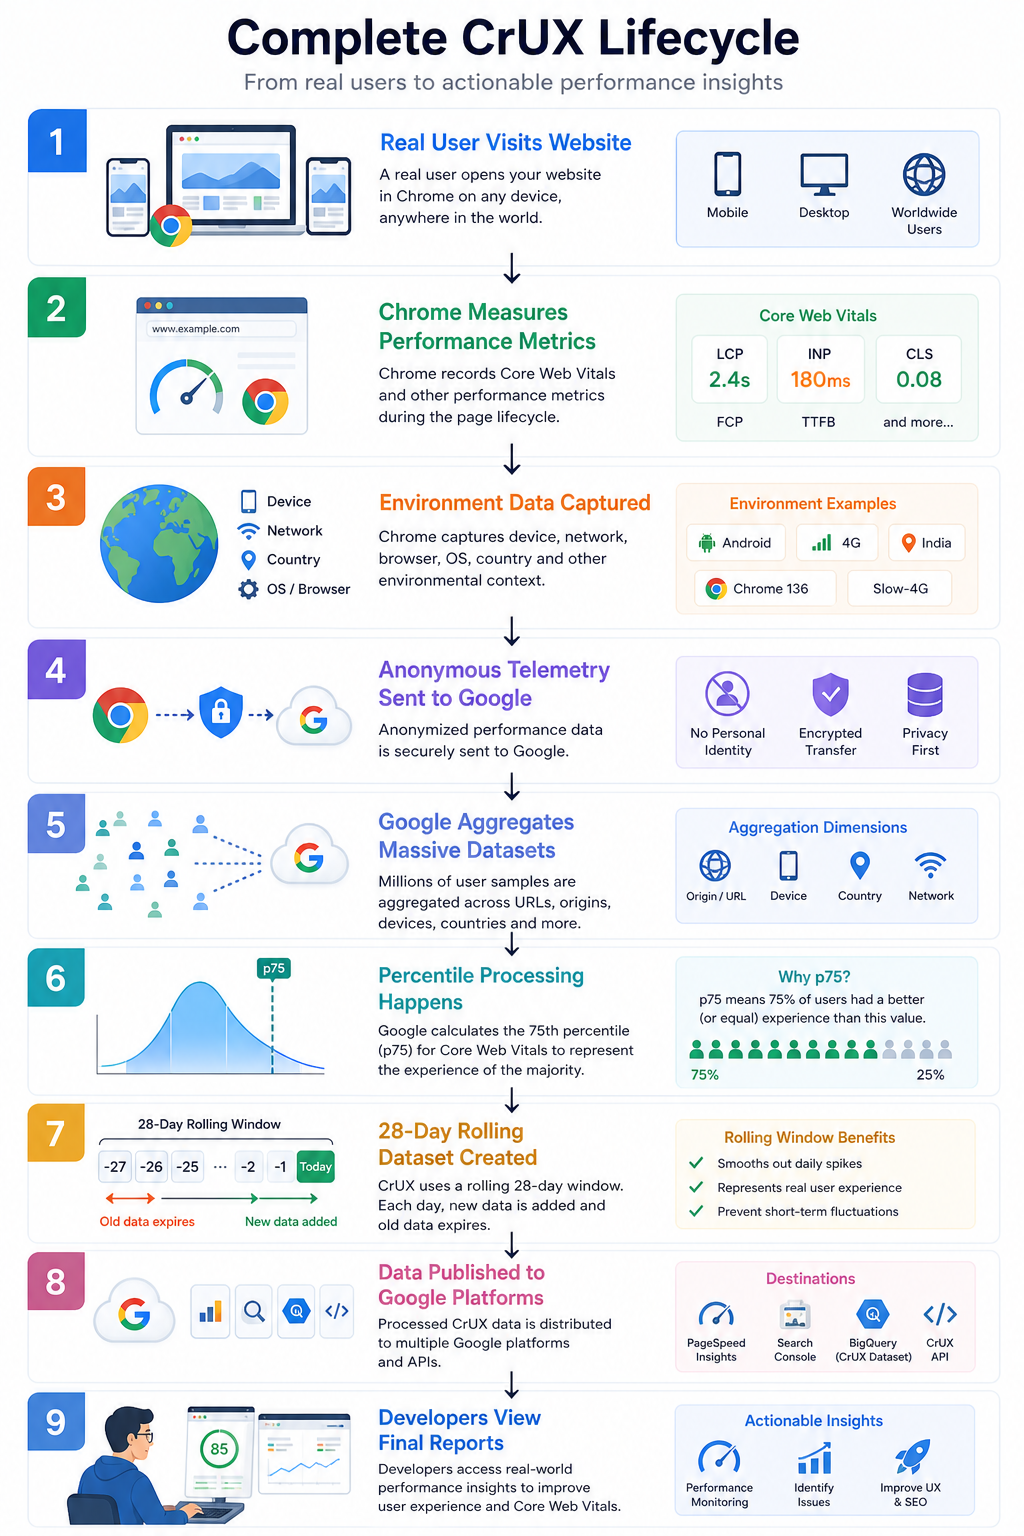
The Full CrUX Collection Pipeline
The sections below follow one logical path: from the first navigation to the developer-facing report.
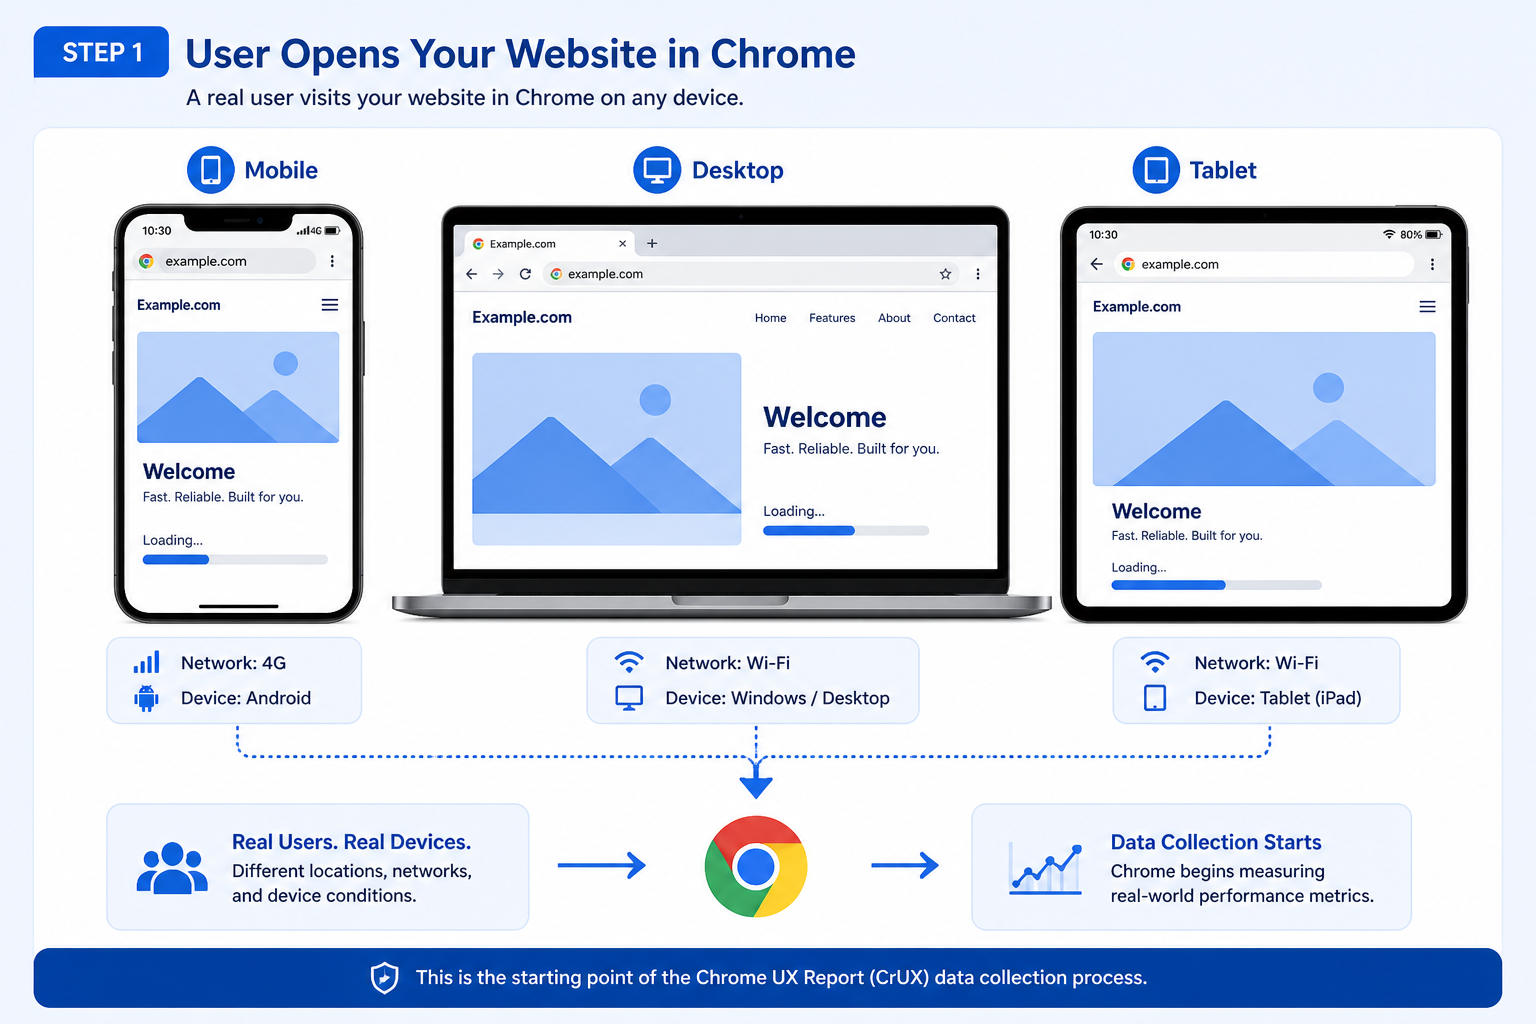
Step 1: User Opens Your Website in Chrome
Everything begins when a real user visits your site using the Chrome browser, for example:
https://example.comThat visit might be on mobile, desktop, or tablet, across different operating systems and network conditions. Chrome can record performance signals as the page loads and as the user interacts, subject to product and privacy rules.
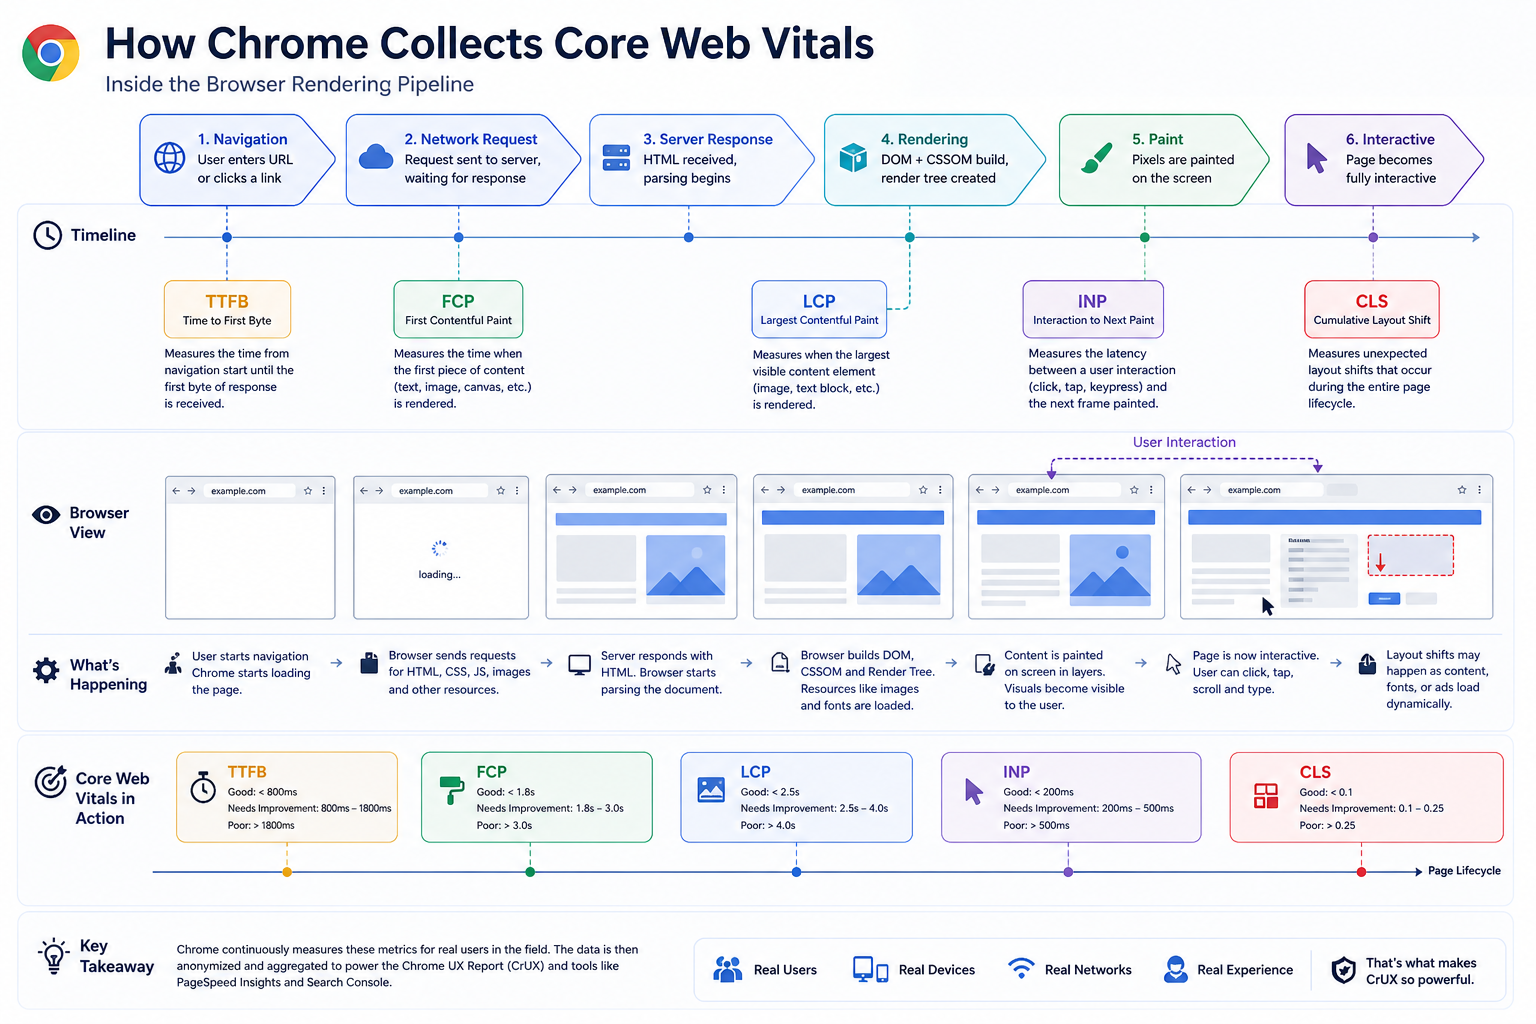
Step 2: Chrome Measures Real User Metrics
Once the page starts loading, the browser records runtime performance metrics. For Core Web Vitals and related experience signals, teams commonly track:
| Metric | Meaning |
|---|---|
| LCP | Largest Contentful Paint |
| INP | Interaction to Next Paint |
| CLS | Cumulative Layout Shift |
| FCP | First Contentful Paint |
| TTFB | Time to First Byte |
Chrome measures actual rendering and timing behavior inside the browser, for example:
- How long the largest visible content took to render
- When the page became responsive enough for interaction
- Whether layout shifted during loading
- Whether long tasks or rendering work delayed paint
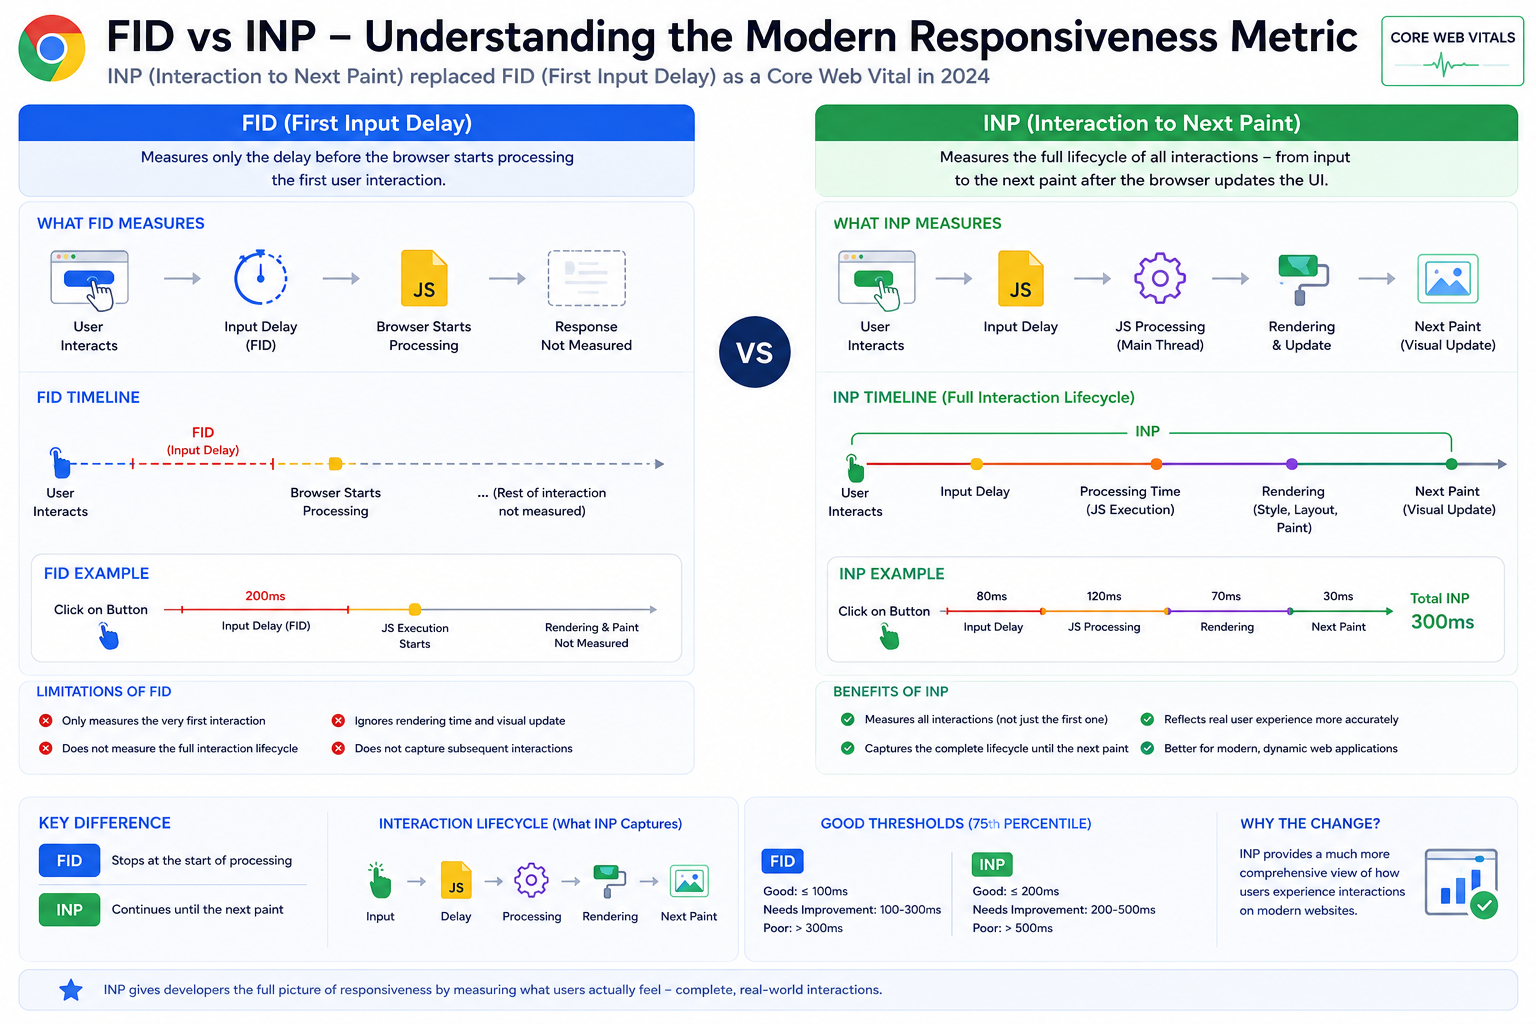
INP Replaced FID as a Core Web Vital
In 2024, Google officially replaced FID (First Input Delay) with INP (Interaction to Next Paint) as the responsiveness metric in Core Web Vitals. See also the INP metric.
Why Google Replaced FID
FID only measured the delay before the browser started processing the first interaction. It did not measure:
- Interaction completion time
- Rendering delays after input
- How long until the UI visibly updated
INP is broader: it reflects the full interaction lifecycle toward the next paint, that makes INP a closer match to real-world responsiveness than first-input delay alone.
Why INP Is often Difficult to Optimize
JavaScript-heavy sites often struggle with INP because of:
- Long main-thread tasks
- Heavy hydration
- Framework rendering cost (for example React reconciliation)
- Third-party scripts
- Client-side rendering bottlenecks
That is one reason teams can see strong Lighthouse numbers and still see poor interaction experience in CrUX.
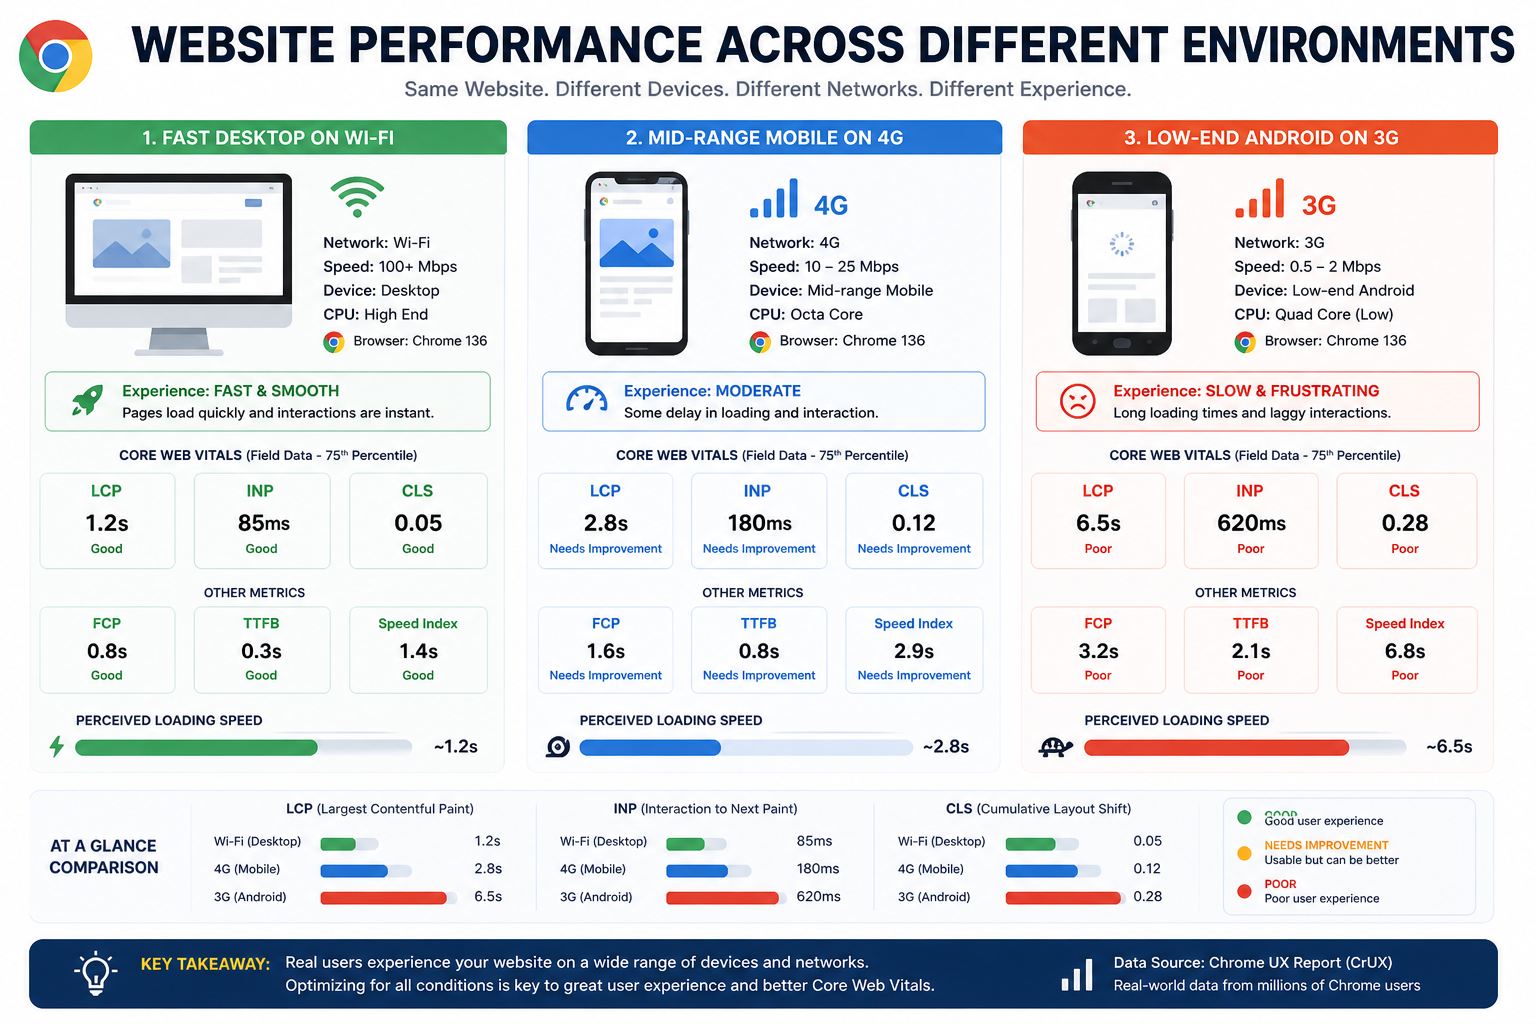
Step 3: Browser Environment Information Is Captured
CrUX is not only “one number per metric”. Chrome also associates samples with coarse environment dimensions so reports can be split and interpreted fairly, for example:
| Environment data | Example |
|---|---|
| Device type | Phone / desktop / tablet coarse classes |
| Connection / effective type | Wi-Fi, cellular classes where available |
| Geography | Country-level buckets |
| Chrome version / platform | Major-version-style reporting dimensions |
Performance varies sharply between a fast desktop on fiber and a constrained phone on a weak link. Environment metadata explains why aggregates and segments can differ from your laptop Lighthouse run.
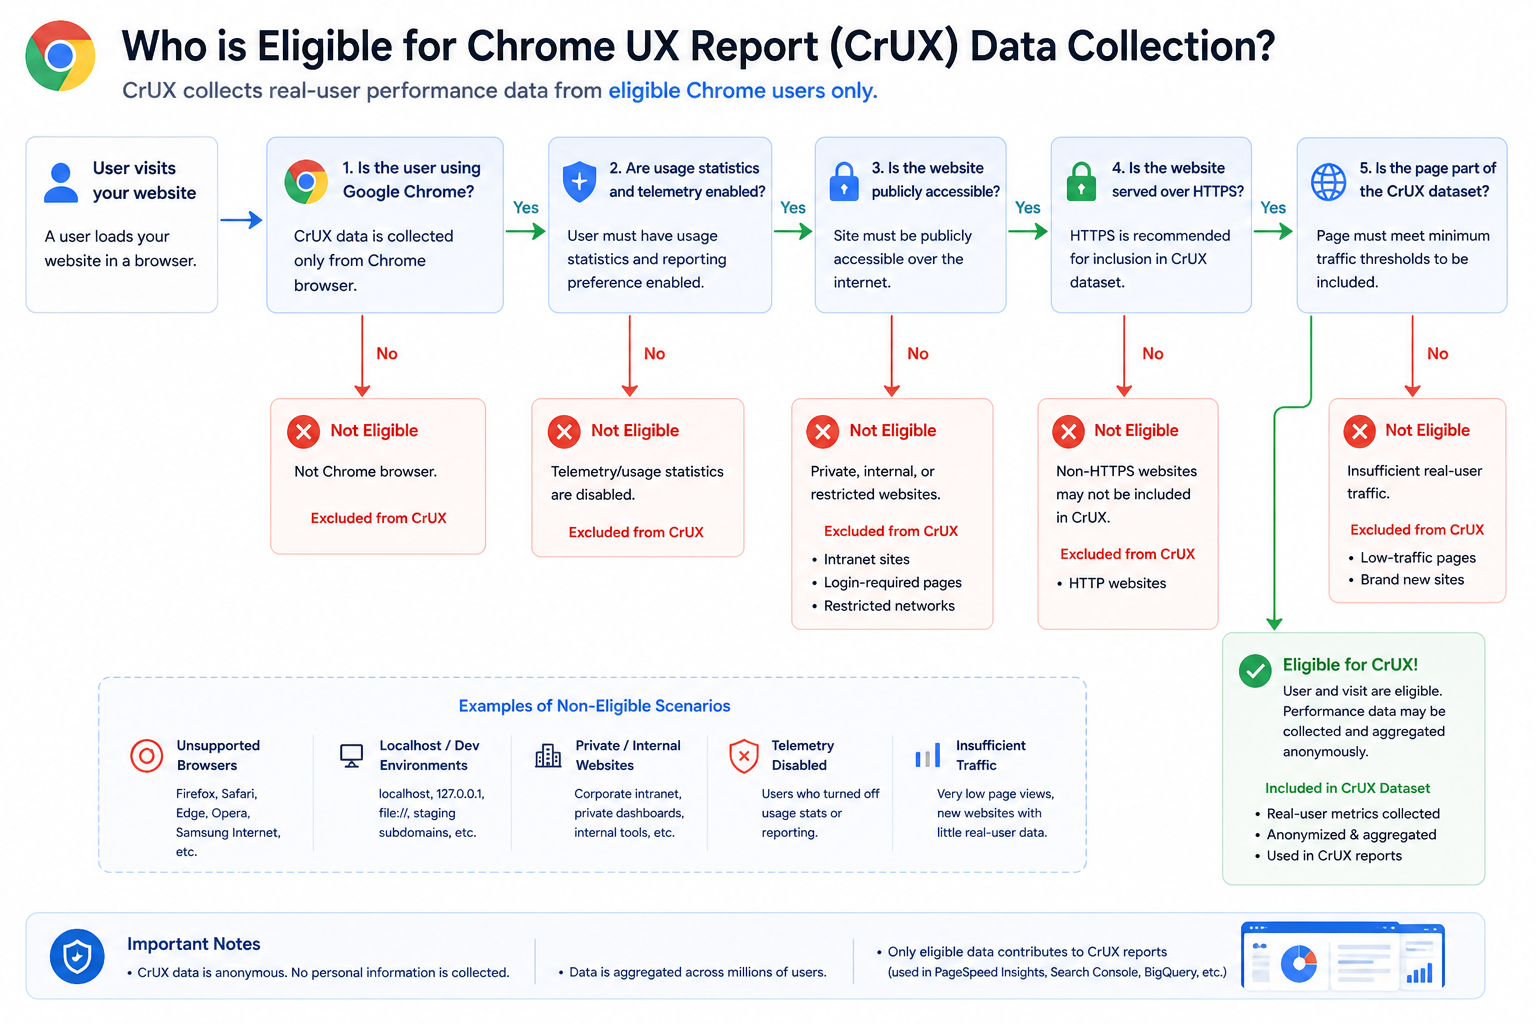
Step 4: Only Eligible Traffic Contributes
Not every page load becomes a CrUX sample. In practice, data comes from Chrome clients that participate in the usage statistics / UX reporting population Google relies on for this dataset, and from public origins people actually visit.
Expectations teams should internalize:
- Internal-only, authenticated-only, or non-public experiences may have no or thin CrUX coverage
localhostand many staging hostnames typically do not show up as stable CrUX origins- Low-traffic origins can fail minimum sample thresholds, so URL-level or origin-level reports may be missing until volume grows
That is a structural reason small or new sites sometimes see “no field data” in PSI while Lighthouse still runs.
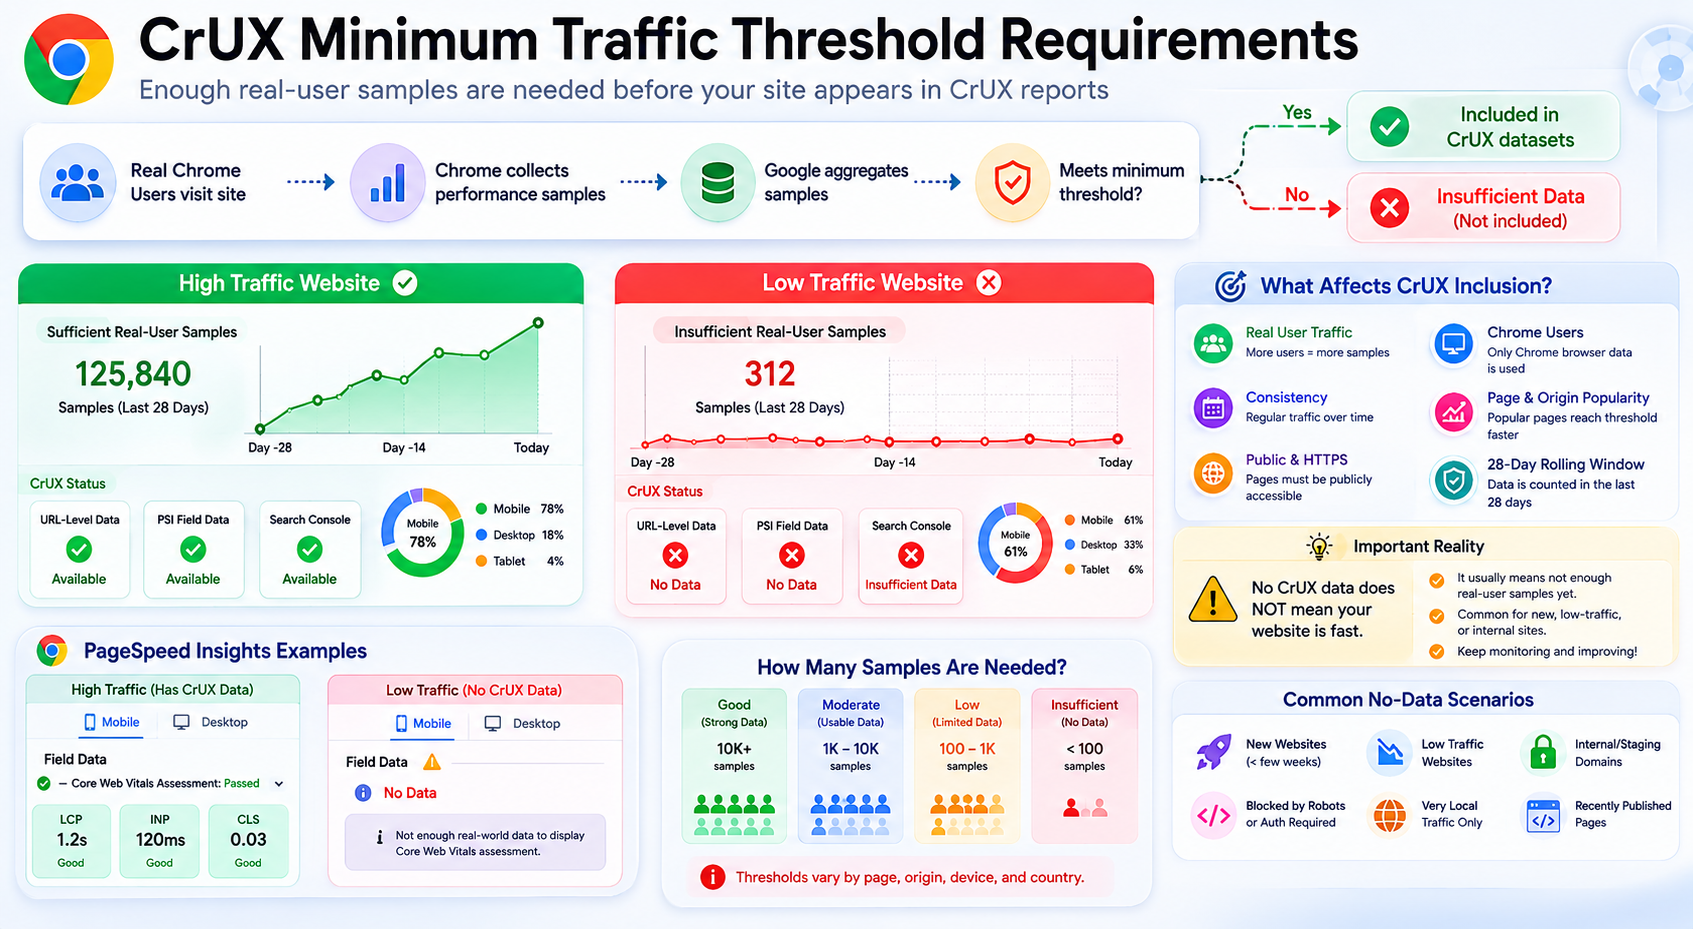
CrUX Requires Minimum Traffic Thresholds
A site does not automatically appear in CrUX public reports simply because it is live. Google needs enough real-user samples for statistically reliable aggregates before origin- or URL-level metrics surface in tools.
What Happens if Traffic Is Too Low?
If a page or origin lacks enough visits:
- Field data may be missing in PageSpeed Insights (No data / insufficient samples)
- Search Console can show gaps or “insufficient data” style messaging
- Teams may incorrectly assume the experience is “fine” because the panel is empty
Important Reality
No CrUX data does not mean your website is fast. It often means Google does not yet have enough reliable samples for that cut of the data (origin, URL, segment, or time window).
That is especially common for:
- New sites and freshly launched URLs
- Low-traffic SaaS or B2B properties
- Internal tools and authenticated-only flows
- Staging or non-public hostnames
Treat “no field row” as unknown field UX, not a passing grade.
Step 5: Anonymous Telemetry Reaches Google Backends
After metrics are recorded in Chrome, they are sent into Google’s processing systems as telemetry suitable for aggregation.
Engineering audiences should assume:
- Reports are built for population-level statistics, not per-user public lookup
- Design goals include reducing identifiability and limiting sensitive detail compared to raw browsing logs your server might keep
For the exact privacy posture and methodology, treat official CrUX documentation as the source of truth rather than third-party summaries.
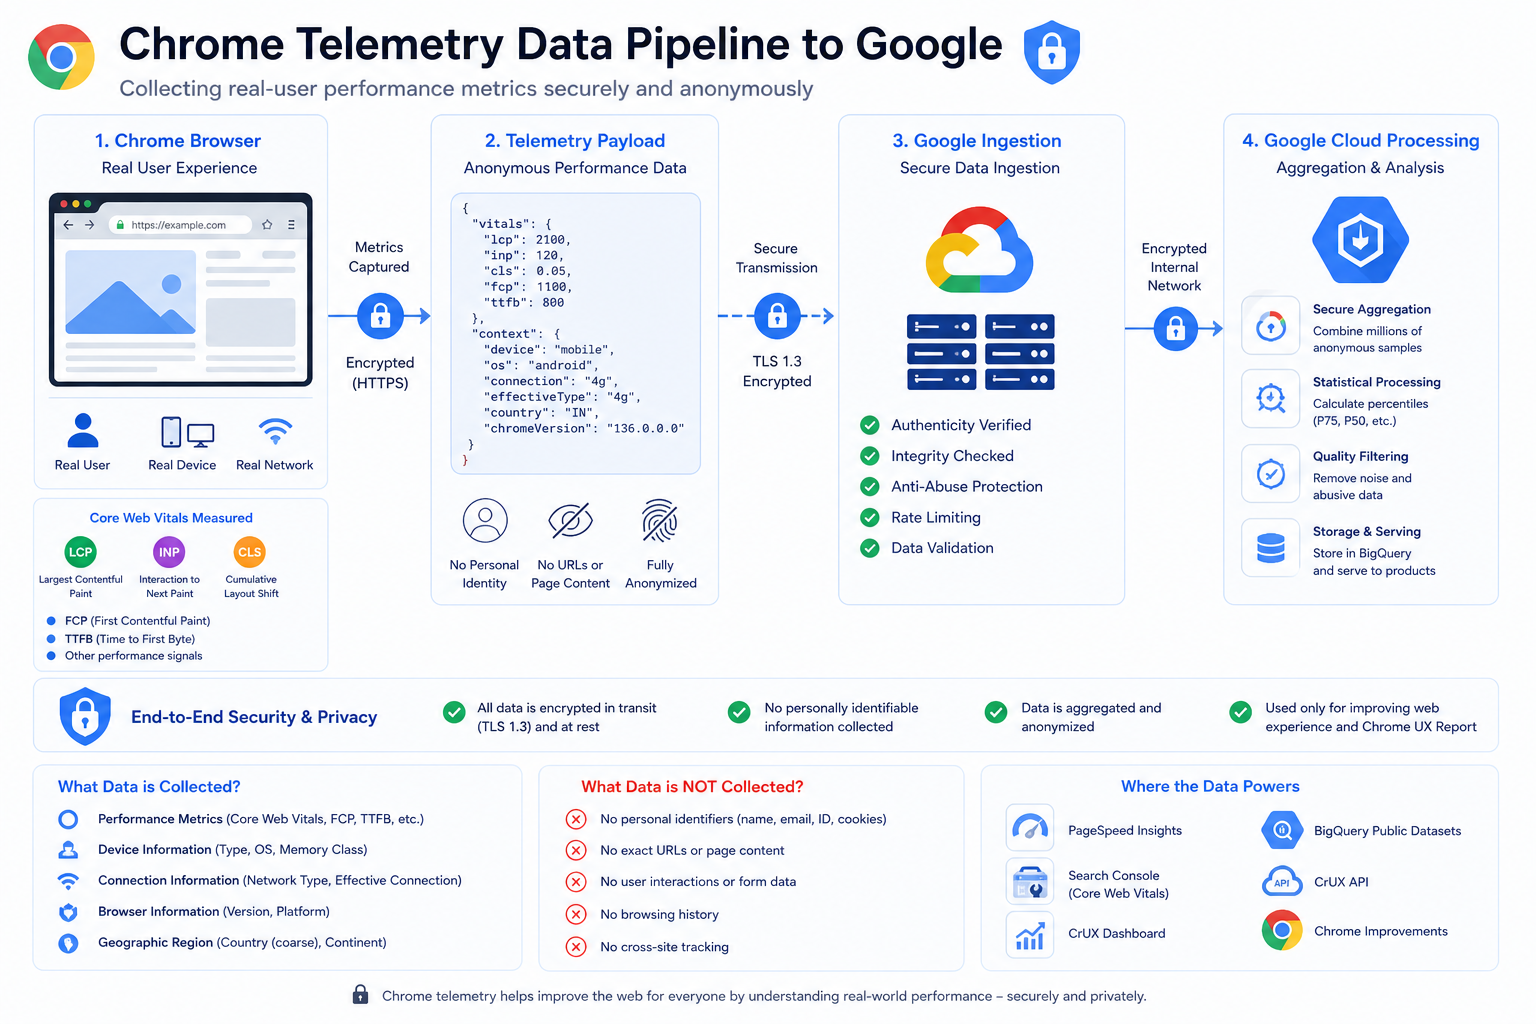
Step 6: Google Aggregates at Scale
Google ingests very large volumes of samples and rolls them up into dimensions product teams consume, including:
| Aggregation type | Example |
|---|---|
| Origin-level | https://example.com |
| URL-level | Individual public URLs when thresholds are met |
| Form factor | Phone vs desktop coarse classes |
| Country | Country-level cuts where available |
Many URL-level samples still contribute primarily to origin-level distributions when URL cardinality or eligibility rules make URL rows sparse.
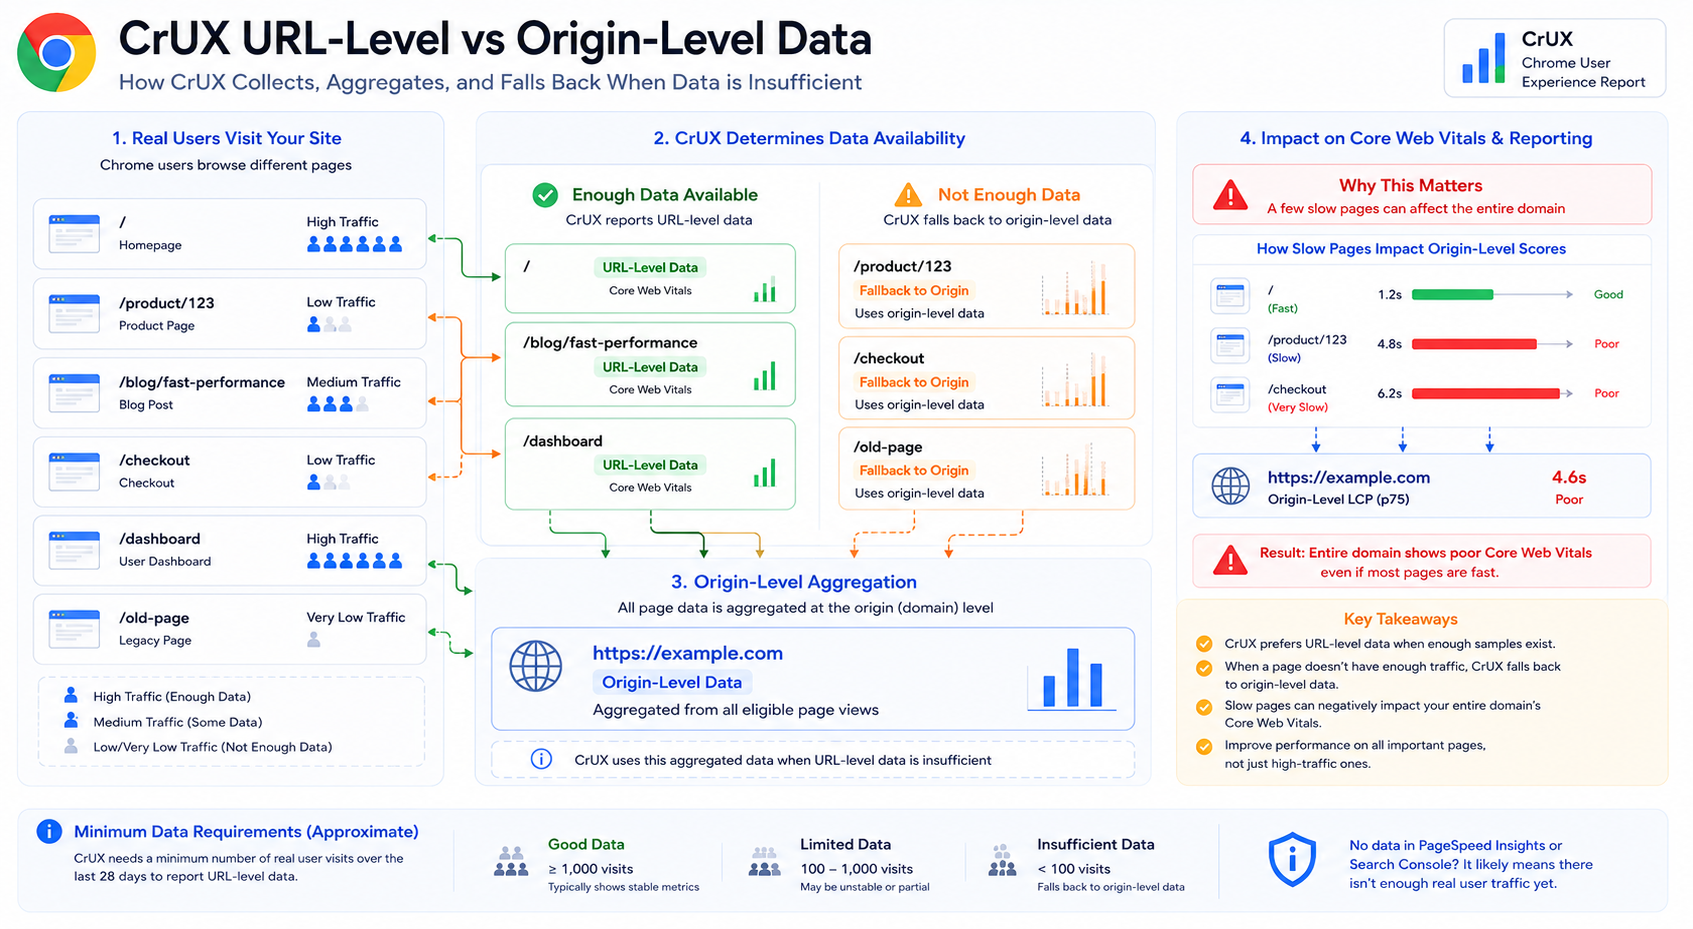
Origin-Level vs URL-Level CrUX Behavior
One of the most confusing parts of reading CrUX is how tooling mixes URL-level cuts with origin-level aggregates.
What Is URL-Level Data?
URL-level data reflects metrics for a specific public URL, for example:
https://example.com/product/123When sample volume is high enough, this is usually the most direct read on that page’s field experience.
What Is Origin-Level Data?
Origin-level data rolls samples up to the whole scheme + host (the origin), for example:
https://example.comThat single series blends traffic from many paths on the site.
When Does CrUX Fall Back to Origin-Level Data?
If there are not enough real-user samples for a URL, CrUX cannot publish stable URL-level statistics for that page. Tools and datasets then lean on origin-level (or coarser) aggregates instead.
Conceptually:
Exact thresholds and UI labels can vary by surface, rely on tool copy and CrUX documentation for specifics.
Why This Matters
A handful of slow, high-traffic pages can pull origin-level Core Web Vitals down even when other routes feel fast in the lab. Common examples include:
- Heavy product detail templates
- Slow checkout or sign-up flows
- Campaign landing pages with large third parties
- Logged-in app shells with heavy client-side work
Those patterns can show up in Search Console, origin-level field sections, and stakeholder summaries as a domain-wide problem.
Step 7: Percentiles, Not Naive Averages
CrUX headlines in tooling usually emphasize high percentiles (historically p75 for many vitals in the reporting people read daily), not simple means.
| Metric (typical reporting) | Common headline statistic |
|---|---|
| LCP | p75 |
| INP | p75 |
| CLS | p75 |
Rough intuition:
Most users at or below the headline value, with the slowest tail defining the reported “field” number.
That tail is why small regressions for unlucky users can move CrUX even when median experience looks fine.
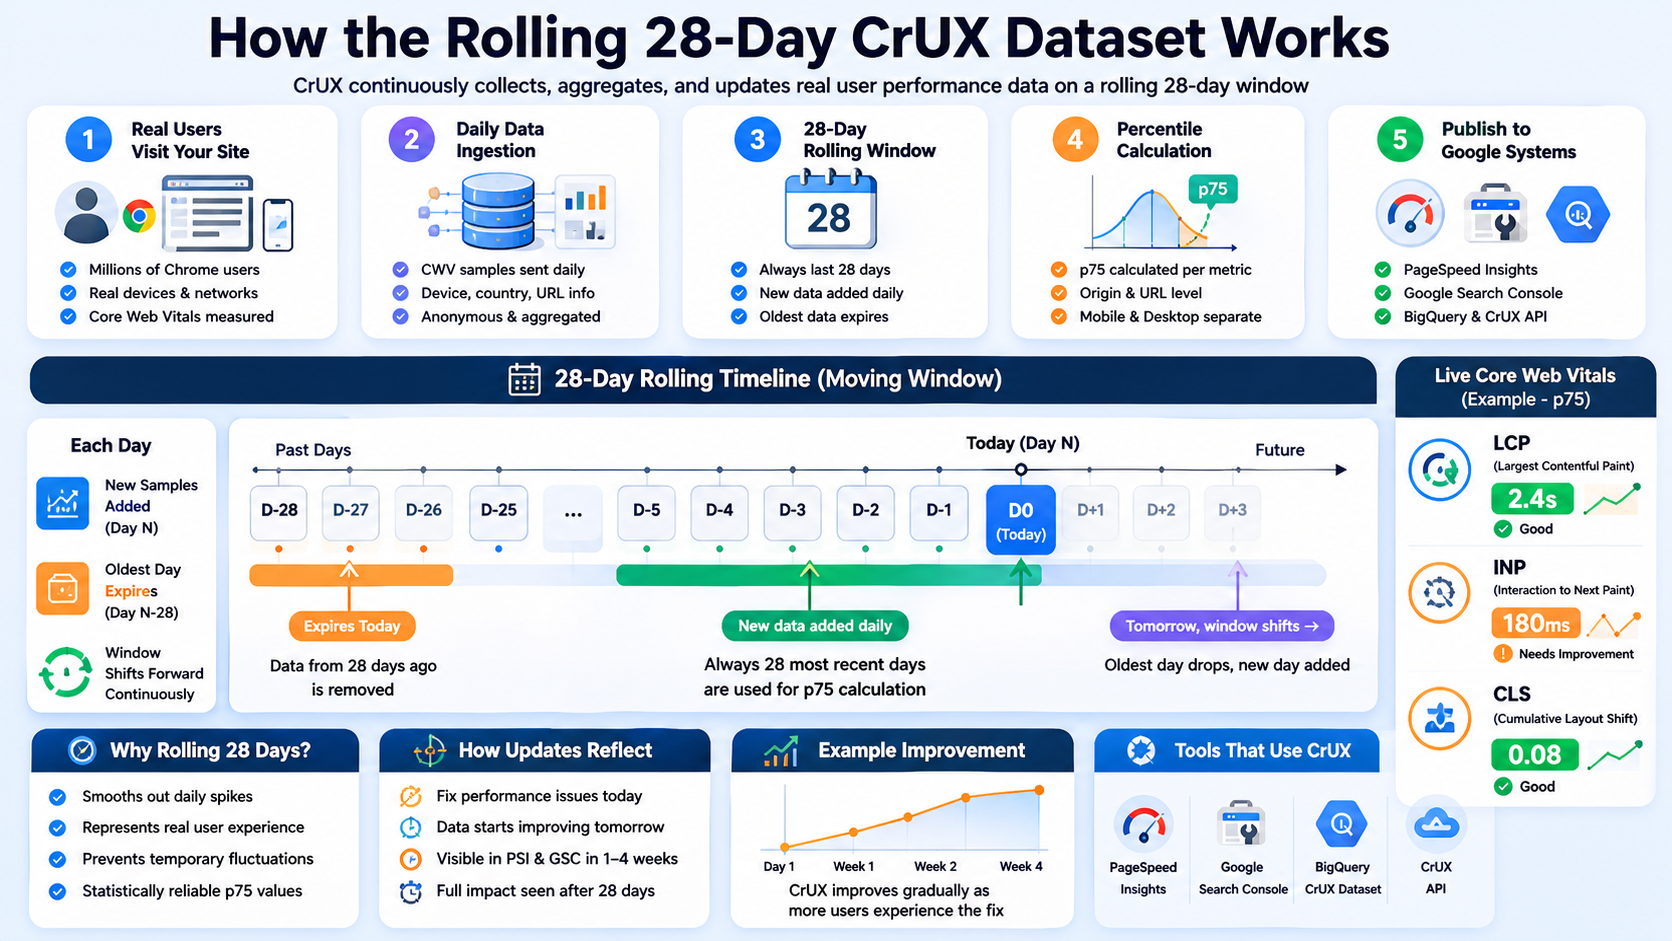
Step 8: Rolling 28-Day Windows
CrUX is not a single-day snapshot. Google maintains rolling windows (commonly discussed as ~28 days in product surfaces), where new data continually arrives and older data ages out.
Effects you will feel in planning:
- Launch-day Lighthouse gains do not flip CrUX overnight
- Fixes need time to burn in across the rolling window
- Short incidents can linger briefly in the tail of the window
For a deeper dive on how that shows up in Search Console timelines, read the cluster guide on the 28-day CrUX window linked in the Introduction.
Why CrUX Improvements Take Time to Appear
A common frustration:
I fixed performance issues, but CrUX still looks bad.
Field data is delayed by design compared with lab reruns.
Difference Between Lab Data and Field Data Timing
| Data type | Update speed |
|---|---|
| Lighthouse lab data | Near-instant on rerun |
| CrUX field data | Rolling, multi-week window |
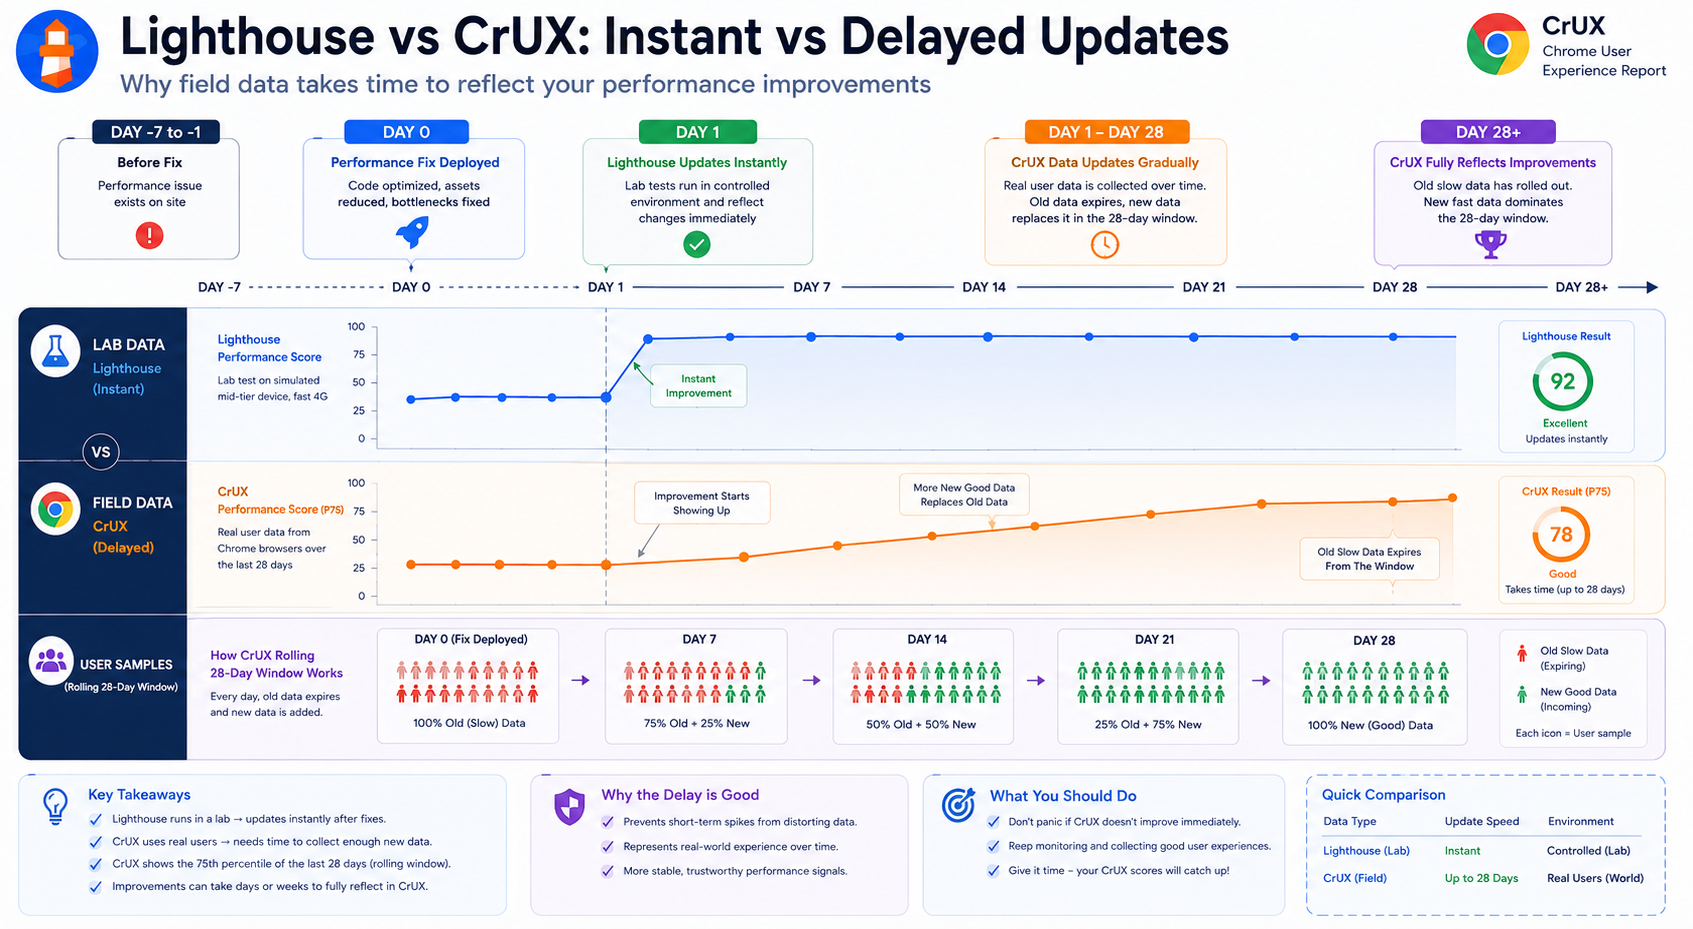
How the Delay Works
CrUX uses a rolling window (commonly about 28 days in product surfaces). That implies:
- Older slow sessions can remain in the statistical mixture until they age out
- New fast sessions gradually change the distribution
- Headline percentiles move slowly, not on deploy day
So: Performance fixes may take days or weeks to fully read out in CrUX.
Why This Is Usually a Good Thing
Rolling windows dampen one-off spikes: bad deploys, short CDN blips, or odd traffic patterns are less likely to permanently “flip” a headline chart compared with a single-day snapshot that overreacts to noise.
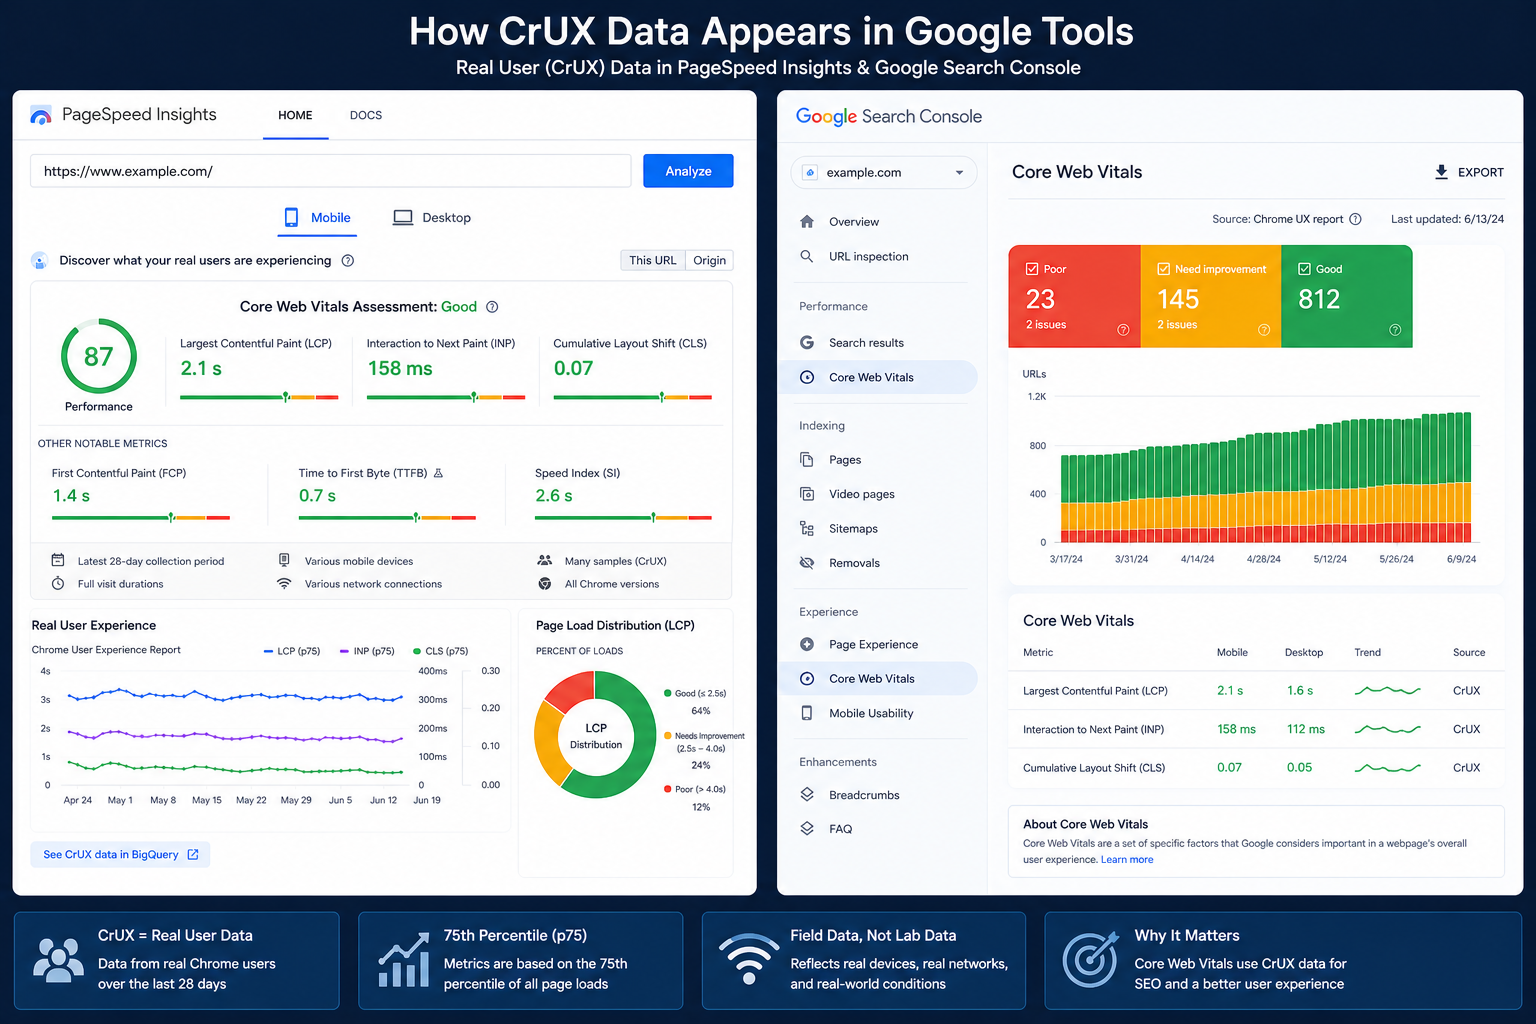
Step 9: Data Is Published to Google Products
After processing, distributions feed multiple experiences, including:
| Platform | Usage |
|---|---|
| PageSpeed Insights | Public origin / URL field sections |
| Search Console | Site owner Core Web Vitals reporting |
| BigQuery | Analyst-scale downloads and joins |
| CrUX API | Programmatic queries |
That is why field numbers often align across surfaces even when lab diagnostics disagree.
Step 10: Developers Read the Final Reports
Finally, you see CrUX-backed field data inside PageSpeed Insights, Search Console, and API responses.
Those reports help answer questions such as:
- What fraction of real users hit good thresholds for LCP, INP, and CLS?
- Whether mobile and desktop cohorts diverge
- Whether a geography or form factor is dragging aggregates
Why Lighthouse and CrUX Often Differ
| Lighthouse | CrUX |
|---|---|
| Synthetic lab run | Real Chrome users (field) |
| One profile / controlled throttle | Millions of devices and networks |
| Immediate rerun after a deploy | Rolling multi-week window |
| Local or CI execution | Google-aggregated dataset |
Because of that split:
- Lighthouse can jump right after you ship optimizations
- CrUX can take weeks to fully reflect recovery or regressions
For a focused comparison of scoring vs vitals pass/fail semantics, see the cluster guide on Lighthouse vs Core Web Vitals.
Why CrUX Matters for SEO and Product Decisions
Google emphasizes CrUX-style field signals for Core Web Vitals because they approximate what users actually felt in Chrome: devices, networks, caching, third parties, and main-thread contention included.
CrUX is not a replacement for lab testing. It is the counterweight:
- Lab: reproducible, actionable diagnostics
- Field: truth about distributed experience and long tails
Strong SEO and product outcomes usually require both: fix what Lighthouse highlights, then confirm relief in CrUX over time.
CrUX Lifecycle at a Glance
Why Websites Fail CrUX Despite Good Lighthouse Scores
Teams often ship Lighthouse 90+, see fast local loads, and still fail real-user Core Web Vitals in CrUX.
Why This Happens
Lighthouse (and similar lab tools) run in controlled conditions. CrUX reflects everyone hitting your origin in Chrome: slower phones, weak networks, background tabs, CPU contention, extensions, cache variance, and regional latency.
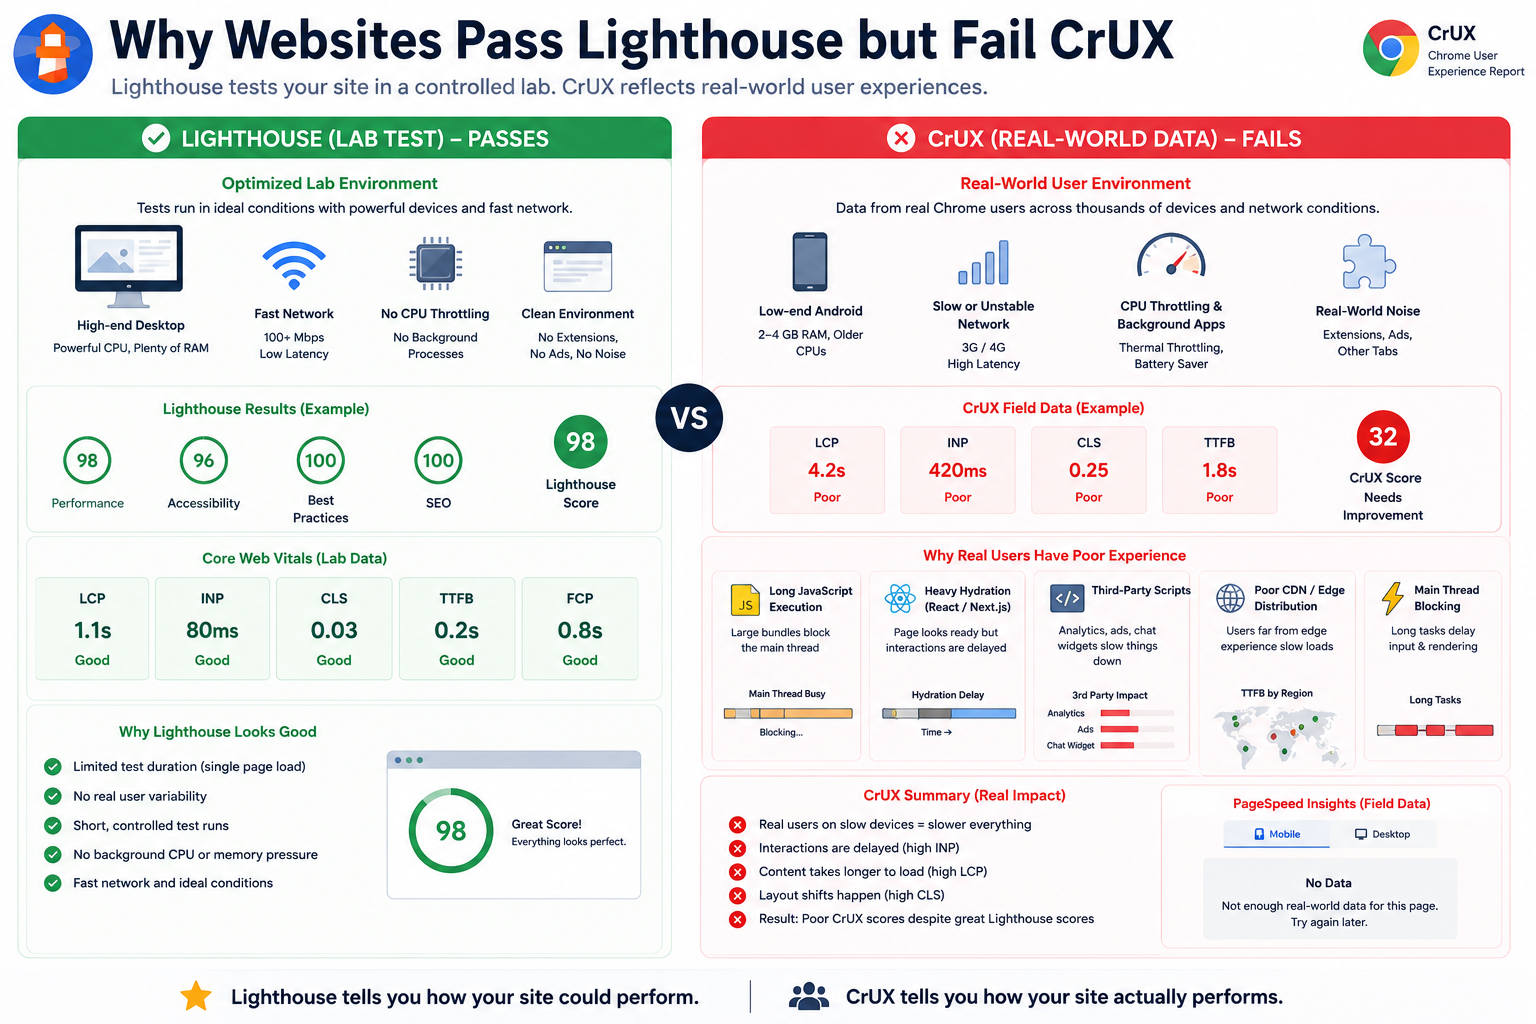
The Most Common Real-World CrUX Bottlenecks
1. Long JavaScript Execution
Large bundles and long tasks monopolize the main thread on weaker devices. That pressure shows up in INP, LCP, and “busy main thread” symptoms, especially on many Android devices.
2. Heavy Hydration in React or Next.js Apps
The server may deliver HTML quickly while the client hydrates slowly. The page can look loaded while taps and scrolls still wait on framework work - a classic INP hit in field data.
3. Third-Party Scripts
Analytics, chat, tag managers, A/B tools, and ads frequently add main-thread blocks, layout instability, and deferred interaction work.
4. Weak CDN Edge Coverage
Fast origin servers do not guarantee fast everywhere. Users far from useful edges can see higher TTFB, delayed images, and worse LCP even when lab tests look great.
5. Main Thread Blocking for Interaction
Large renders, synchronous scripts, heavy animations, or very large DOM trees keep the browser from responding quickly to input - again, mostly an INP story.
The Core Reality
Lighthouse describes how your site can behave under test. CrUX summarizes how it actually behaved for real users.
That is the practical gap between synthetic testing and production UX.
Conclusion
Understanding how CrUX is collected helps explain stubborn gaps between green lab runs and yellow field panels. Many teams optimize Lighthouse in isolation while underestimating long-tail devices, network variability, main-thread work, CDN geography, and rendering bottlenecks that only show up in production-scale data.
If your goals include better Core Web Vitals, more trustworthy performance conversations with stakeholders, and UX that holds up in the wild, treat CrUX as the field source of truth and Lighthouse as the lab magnifying glass - not the other way around.
Key Takeaways
- CrUX is real-user, Chrome-based field data aggregated under eligibility and privacy constraints - not a replay of your local Lighthouse run.
- Tooling headlines emphasize high percentiles on rolling windows (often ~28 days), so improvements take time to show up everywhere Search Console and PSI read from.
- Segments and thresholds matter: low traffic, non-public origins, or missing URL-level volume can mean “no field data” even when the site works fine in synthetic tests - empty field panels do not prove a fast site.
- Origin vs URL: sparse URL samples roll into origin-level views, a few slow, high-traffic routes can drag whole-domain reports.
- INP replaced FID as the Core Web Vitals responsiveness metric, optimizing interaction latency often matters more than chasing a single lab “performance score”.
- Lab vs field: use Lighthouse (or similar) for reproducible debugging, use CrUX to validate that fixes actually reach real users at scale.
Next Steps
- Open PageSpeed Insights for your origin and compare Field vs Lab sections side by side.
- In Search Console, review Core Web Vitals trending over time rather than single-day spot checks.
- Pair this with Debugging hidden LCP issues when lab and field disagree on Largest Contentful Paint.