Introduction
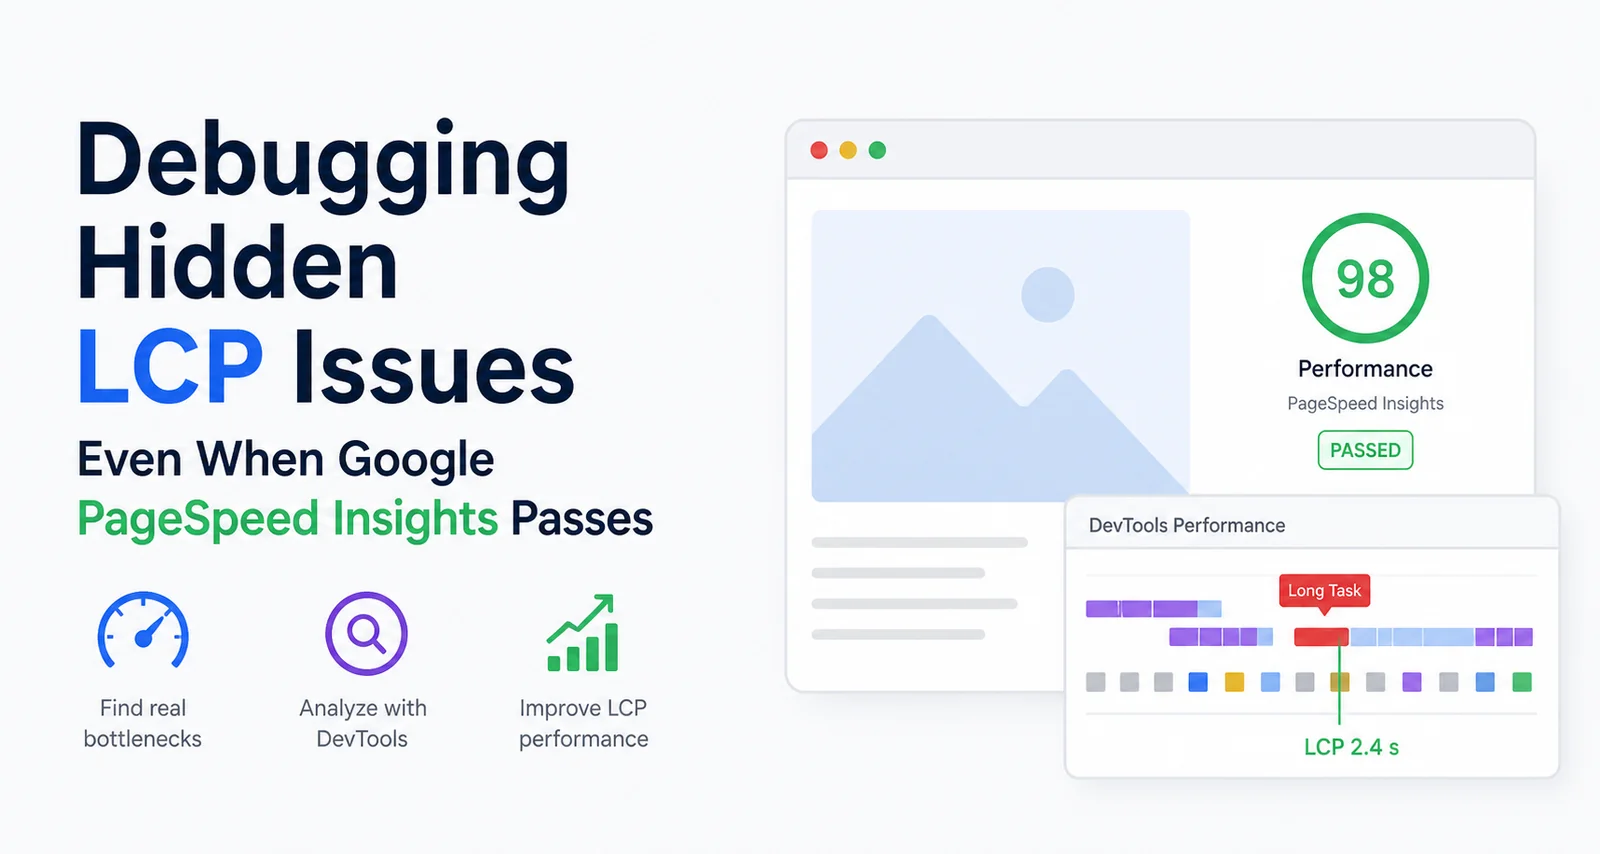
Largest Contentful Paint (LCP) is one of the most influential Core Web Vitals metrics for perceived load performance. Teams often see green scores in Google PageSpeed Insights while users still report slow rendering, sluggish first paint, or inconsistent performance from session to session.
That gap usually points to a hidden rendering bottleneck that synthetic scoring does not surface under every test condition. For frontend performance work, this article walks through a practical workflow: using Chrome DevTools and the Performance panel to reproduce a “fresh user” load, expose main-thread blocking, and tie findings back to LCP, without relying on a single PSI run in ideal conditions.
Related guides: Lighthouse vs Core Web Vitals (lab vs field), viewport width and why lab testing uses 412px, how the 28-day CrUX rolling window affects dashboards, and how CrUX collects real user performance data end-to-end.
Why Hidden LCP Issues Still Happen
Even when a PageSpeed Insights report looks healthy, issues can remain hidden because:
- Cached assets mask cold-load cost
- Service workers serve fast or stale optimized responses
- Render-blocking requests defer first paint
- Heavy JavaScript monopolizes the main thread
- Fonts and icon fonts delay text and layout
- Third-party scripts inject work at the wrong time
- CPU-heavy hydration delays when the largest element can be considered “painted”
Lab scores may look green because repeat-view cache helps, local hardware is fast, or test conditions are not representative of weak devices and networks. To find real bottlenecks, debugging should aim to simulate a first-time visitor under constrained conditions.
Step 1: Start With PageSpeed Insights Diagnostics
Begin in the PageSpeed Insights Performance category and open the Diagnostics (and related) guidance - the same family of audits you see in Lighthouse.
Pay special attention to items such as:
- Avoid long main-thread tasks
- Reduce unused JavaScript
- Eliminate render-blocking resources
- Minimize main-thread work
- Reduce JavaScript execution time
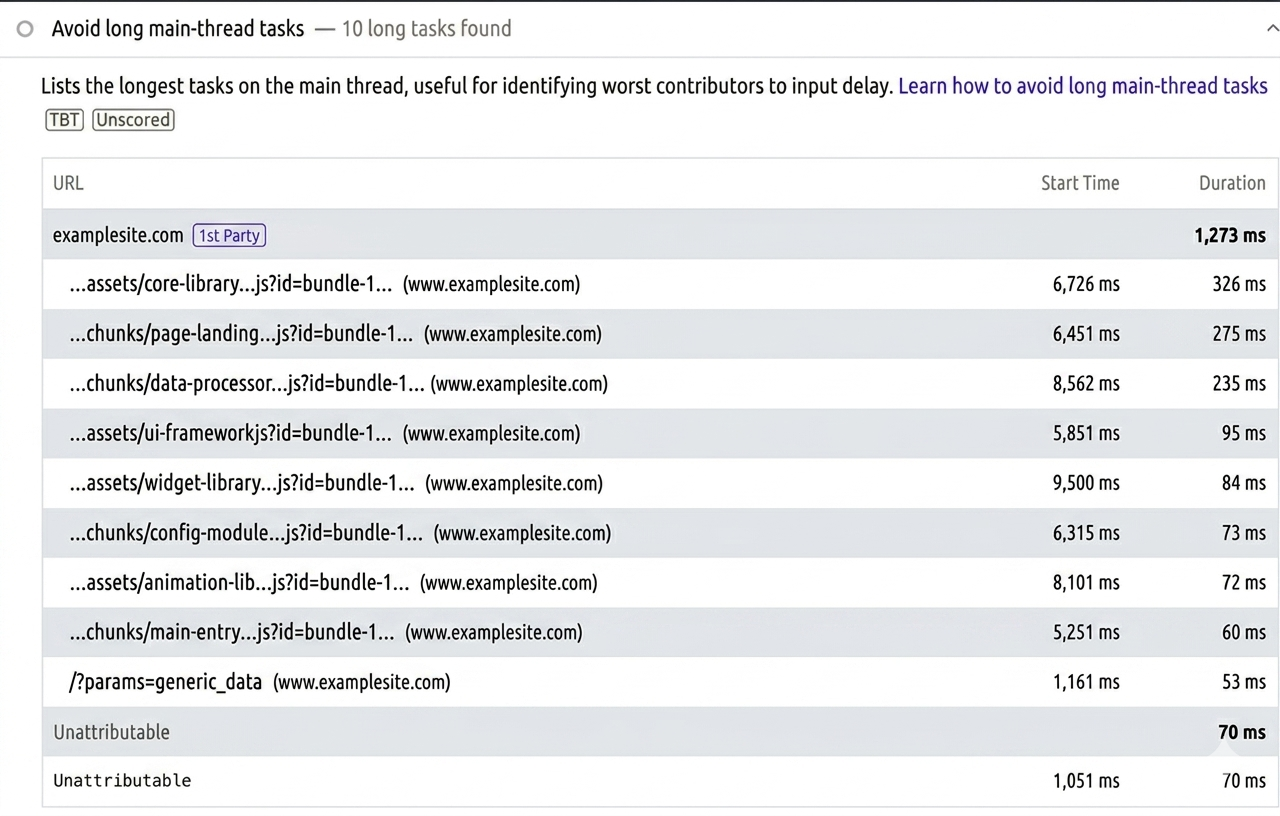
Avoid Long Main-Thread Tasks
For “invisible” LCP pain, “Avoid long main-thread tasks” is often the strongest signal. It usually means:
- JavaScript execution is delaying rendering
- Hydration or framework boot is expensive
- Synchronous work blocks paint even after the network goes quiet
- The LCP element is delayed because the main thread is busy
Treat diagnostics as hypotheses to confirm in a local trace, not as the final verdict.
Step 2: Prepare a Clean Debugging Environment Locally
Before recording traces, strip away cached optimizations so the timeline matches a cold visit.
Open Chrome DevTools
Navigate to:
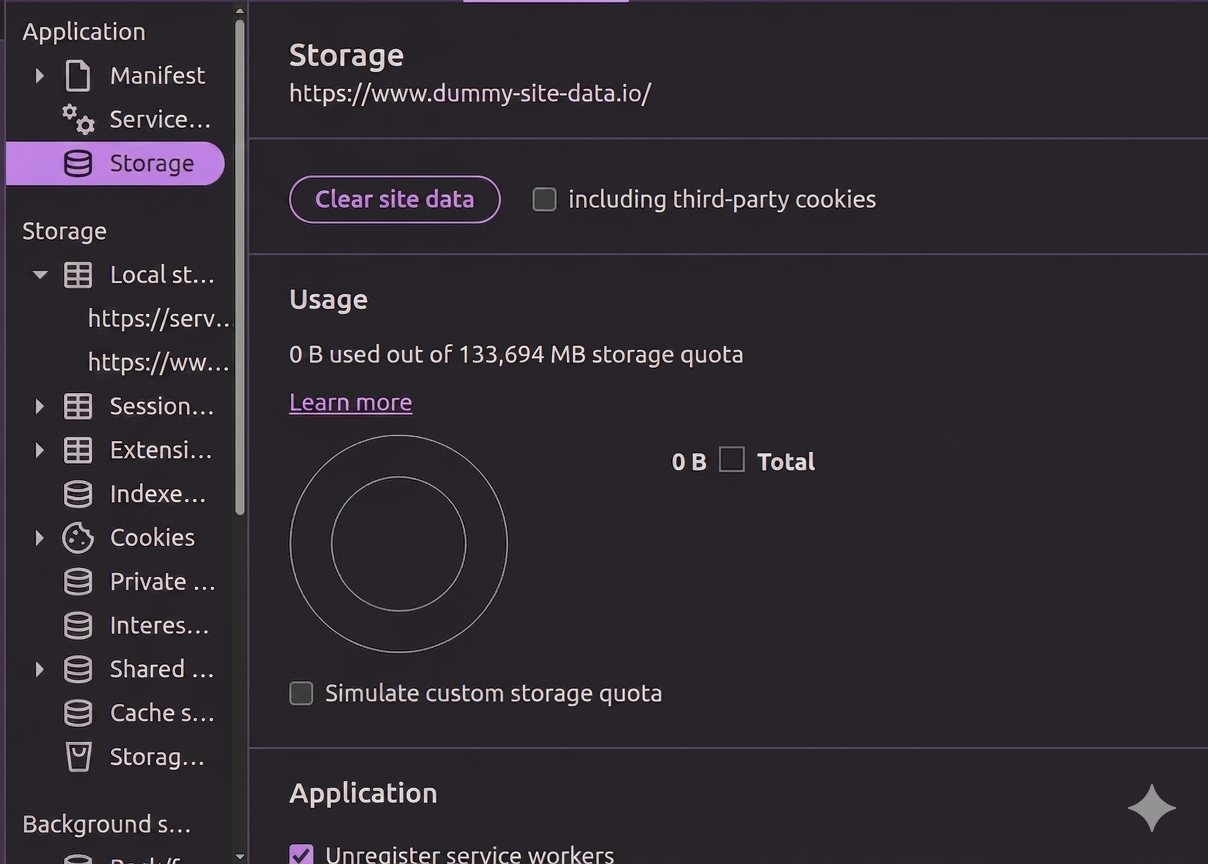
Chrome DevTools -> ApplicationClear Site Data
In Storage:
- Click Clear site data
- Confirm usage shows no meaningful residual storage (goal: a clean session for that origin)
This reduces cached assets, persisted storage, and other state that can hide real costs.
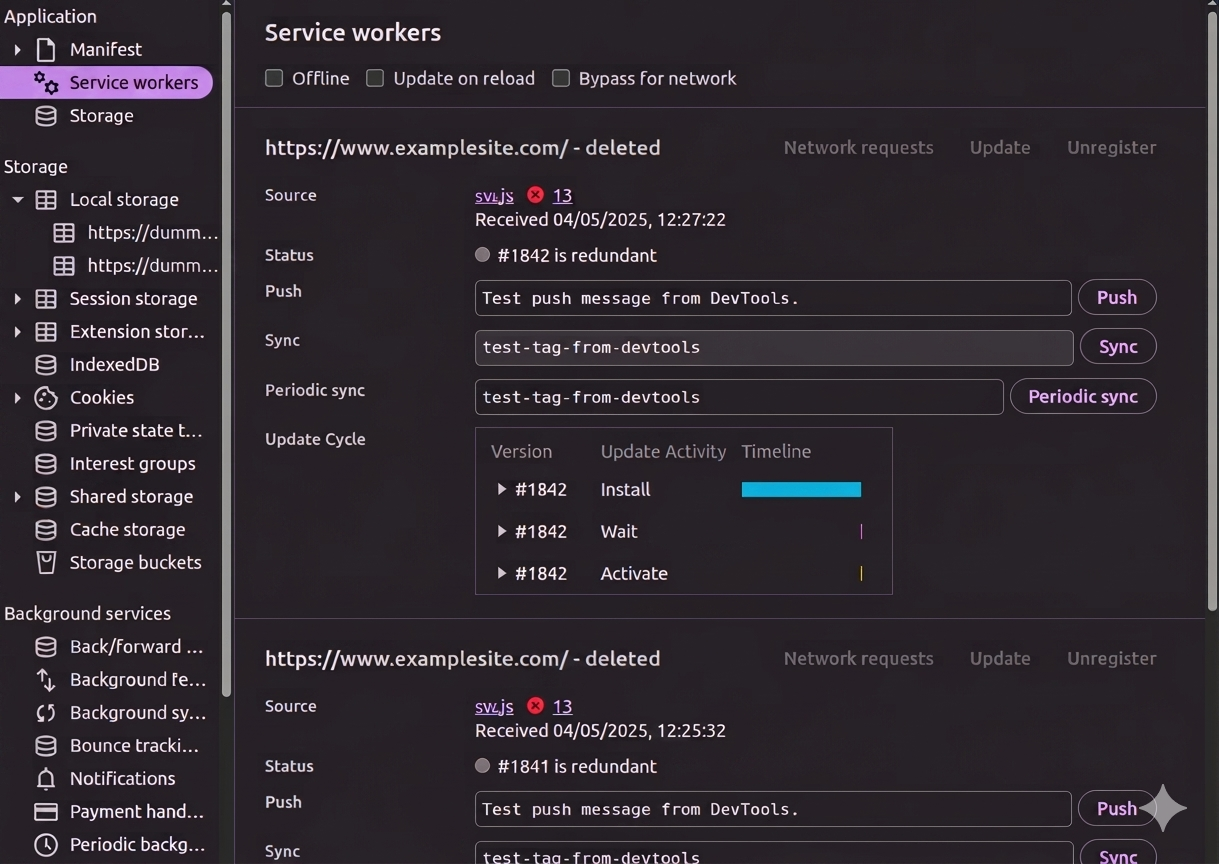
Unregister Service Workers (Important)
If the site uses a service worker or PWA shell:
Application -> Service Workers -> UnregisterService workers may precache bundles, serve from cache, or short-circuit the network, all of which can make LCP look better in dev than it is for a truly cold load. Skipping this step is a common reason “PSI passes” does not match some user sessions.
Step 3: Simulate Realistic Network Conditions
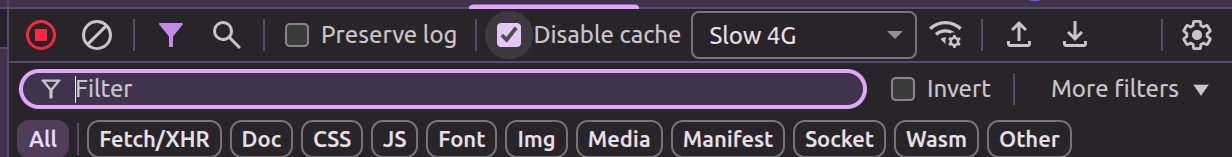
Open the Network panel and enable:
- Disable cache
- Slow 4G (or another throttling preset that matches your audience)
Together, this approximates slower bandwidth, delayed scripts, and more honest rendering timing. Without throttling and a clean cache, long tasks and blocking often stay invisible.
Step 4: Record a Performance Trace Properly
Open the Performance panel.
Start recording with either:
Ctrl + Shift + E   (Windows / Linux)
Cmd + Shift + E    (macOS)
or use Record and reload so the capture includes navigation from a blank state.
A good trace includes:
- Rendering and painting timeline
- Script execution blocks
- Layout and long tasks (where surfaced)
- Network waterfall aligned to the main thread
- Markers that help locate when the LCP element could paint
Use Record and reload (or the keyboard shortcut above) so the timeline starts from navigation; align the filmstrip and Timings lane with when the LCP marker appears.
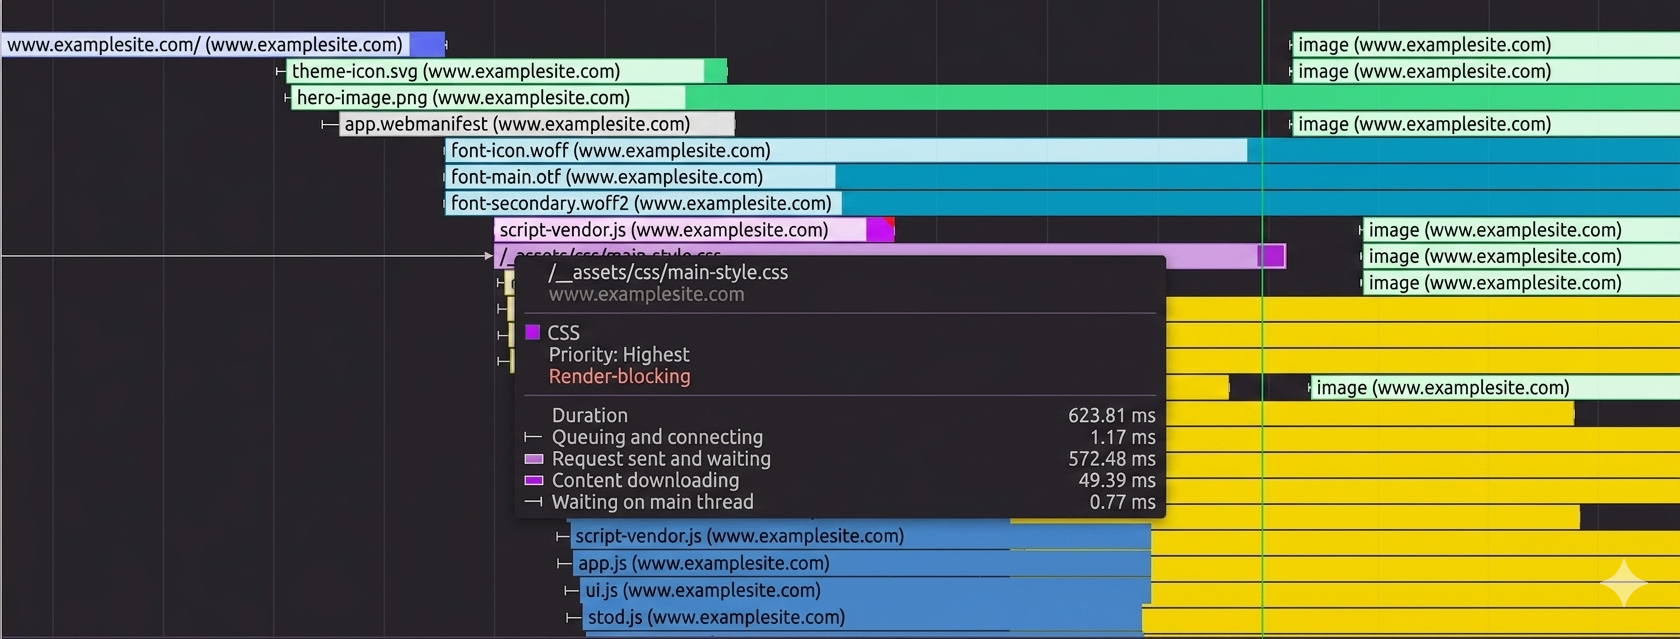
Step 5: Identify Render-Blocking Requests
In the Performance waterfall, requests highlighted in purple often indicate render-blocking relationships in the tooling’s visualization (exact coloring can vary by Chrome version - use the tooltip and “Initiator” / “Timing” detail to confirm).
These are typically:
- Render-blocking CSS
- Parser-blocking or early JavaScript
- Font requests on the critical path
- Synchronous dependencies that defer first paint
Correlate those blocks with long tasks on the main thread and with when your LCP candidate becomes available in the Experience / Timings context of the recording.
Common Hidden LCP Culprits
Heavy JavaScript Hydration
Large client bundles and full-page hydration delay when the largest in-view content is ready.
Typical issues:
- Oversized bundles
- Hydrating non-interactive markup
- Deep dependency graphs
Mitigations: code splitting, lazy loading, dynamic import(), partial or islands hydration where appropriate, and removing unused libraries.
Font Loading Delays
Custom fonts and icon packs often sit on the critical path.
Examples: hosted font services, IcoMoon, Font Awesome.
Mitigations: font-display: swap (with acceptable FOUT policy), preload only truly critical faces, self-host when it reduces chain length, and trim weights and subsets.
Render-Blocking CSS
Large CSS files can delay first paint.
Mitigations: critical CSS for above-the-fold content, defer non-critical CSS safely, remove unused CSS, and split bundles by route where the build supports it.
Third-Party Scripts
Analytics, tag managers, heatmaps, chat, and experimentation often schedule work during load.
Mitigations: defer or load after consent or interaction, shed nonessential tags, and measure each third party in a trace.
Large Image Decoding and Sizing
Even “optimized” images can hurt LCP if decode is expensive or layout is unstable.
Mitigations: explicit width and height (or stable aspect-ratio), appropriate priority / fetchpriority for the true LCP image, modern formats with fallbacks where needed, and avoiding oversized intrinsic dimensions.
Important Observation
A green Lighthouse or PSI run does not guarantee that:
- Real users always see fast rendering, or
- Mid-tier devices on variable networks behave the same way
Validate with throttled CPU and network, cache disabled, service workers unregistered for the test, and Performance profiling on cold loads - then retest after changes.
Recommended Debugging Workflow
Use a consistent sequence:
- Run PageSpeed Insights and note Diagnostics (especially main-thread audits)
- Clear site data for the origin under test
- Unregister service workers (when applicable)
- In Network: Disable cache and Slow 4G
- In Performance: Record and reload
- Map purple / blocking-class requests and long tasks to delayed paint
- Apply targeted fixes (fonts, CSS, JS split, third parties, LCP image)
- Repeat the same cold-load recipe and compare traces
Best Practices for Stable LCP Optimization
These habits support frontend performance beyond a single audit: they keep LCP stable as bundles, fonts, and third parties change.
Prioritize the Critical Rendering Path
Focus LCP improvements on:
- Above-the-fold content and the true LCP element (often a hero image or headline block)
- Critical CSS and font strategy
- Minimizing blocking work before that element can paint
Reduce Main-Thread Work During Load
Keep initial JavaScript execution as small as necessary so paint and interaction are not crowded out.
Avoid Over-Hydration
Hydrate only what must be interactive on first view; defer the rest.
Continuously Test Under Throttled Conditions
Make Slow 4G + clean storage (and optional CPU throttling) a routine part of releases, not a one-off audit.
Conclusion
Hidden LCP problems are frequently masked by cache, service workers, fast dev hardware, or repeat visits. PageSpeed Insights can pass while main-thread congestion or render-blocking still punishes cold loads on real networks.
The most dependable approach is to reproduce a fresh user session, throttle realistically, inspect long main-thread tasks, and tie network blocking to paint using Chrome’s Performance tooling - then iterate with the same recipe so improvements are measurable.
Key Takeaways
- Lab green does not equal all users happy - validate cold loads without cache and with realistic throttling.
- Unregister service workers and clear site data when debugging so SWs and storage do not fake a fast first paint.
- “Avoid long main-thread tasks” in PSI/Lighthouse diagnostics is a leading indicator to confirm in a Performance trace.
- Purple or blocking-class requests in the waterfall deserve a direct line to font, CSS, JS, and third-party fixes.
- Repeat the same profiling recipe after each change so LCP gains are real, not an artifact of test conditions.
Next Steps
- Run one Record and reload trace on a clean, throttled session and save a baseline.
- Pick the single largest contributor (blocking CSS, one script, or the LCP image) and fix it in isolation.
- Re-run PSI and DevTools traces to confirm LCP and long tasks move in the right direction.
Additional Resources
- Largest Contentful Paint (LCP) - definitions, thresholds, and optimization patterns
- Optimize Largest Contentful Paint - actionable LCP checklist
- Analyze runtime performance - Chrome DevTools Performance reference
- PageSpeed Insights - field and lab reports for public URLs